By Steve Bolton
…………It may be called Minitab, but SQL Server users can derive maximum benefits from the Windows version of this professional data mining and statistics tool – provided that they use it for tasks that SQL Server doesn’t do natively. This was one the caveats I also observed when appraising WEKA in the first installments of this occasional series, in which I’ll pass on my misadventures with using various third-party data mining tools to the rest of the SQL Server community. These are intended less as formal reviews than preliminary answers to the question, “How would these fit in a SQL Server data miner’s toolbox?”
…………WEKA occupies a very small place in that toolbox, due to various shortcomings, including an inability to handle datasets that many SQL Server users would consider microscopic. In a recent trial with Minitab 17.1 I encountered many of the same limitations, but at much less serious levels – which really ought to be the case, given that WEKA is a free open source tool and Minitab costs almost $1,500 for a single-user license. I didn’t know what to expect going into the trial, since I had zero experience with it to that point, but I immediately realized how analysts could recoup the costs in a matter of weeks, provided that they encountered some specific use cases often enough. Minitab is useful for a much wider range of scenarios than WEKA, but the same principles apply to both: it is best to use SQL Server for any functionality Microsoft has provided out-of-the-box, but to use these third-party tools when their functionality can’t be coded quickly and economically in T-SQL and .Net languages like Visual Basic. Like most other analysis tools, Minitab only competes with SQL Server Data Mining (SSDM) tangentially; most of its functionality is devoted to statistical analysis, which neither SSDM nor SQL Server Analysis Services (SSAS) directly addresses. If I someday had enough clients with needs for activities like Analysis of Variance (ANOVA), experiment design or dozens of specific statistics that aren’t easily calculable in SQL Server, Minitab would be at the top of my shopping list (with the proviso that I’d also evaluate their competitors, which I have yet to do). I’m not a big Excel user, so I can’t speak at length on whether or not it compares favorably, but I personally found Minitab much easier to work with for statistical tasks like these. Minitab has some nice out-of-the-box visualizations which can be done with more pizzazz in Reporting Services, provided one has the need, skills and time to code them. One of Minitab’s shortcomings is that it simply doesn’t have the same “Big Data”-level processing capabilities as SQL Server. This was also the case with WEKA, but Minitab can at least perform calculations on hundreds of thousands of rows rather than a paltry few thousand. It doesn’t provide neural nets, sequence clustering or some of my other favorite SSDM algorithms from the A Rickety Stairway to SQL Server Data Mining series, but it does deliver dozens of alternatives for lower-level data mining methods like regression and clustering which SSDM doesn’t provide. If given the opportunity and the need, I’d incorporate this into my workflows for the kind of hypothesis testing routines I spoke of in Outlier Detection with SQL Server, preliminary testing of statistical code, formula validation and certain data mining problems, when one of Minitab’s specialized algorithms is called for.
…………One pitfall to watch out for when evaluating Minitab is that there are scammers out there selling counterfeit copies on some popular, above-board online shops. They’re just pricy enough to look like legitimate second-software being resold from surplus corporate inventory or whatever; a Minitab support specialist politely advised me that resales are violations of the license agreement, so the only way to get a copy is to shell out the $1,500 fee for a single per-user license. Another Minitab rep was kind enough to extend my trial software for another 30 days after I simply ran out of time to collect information for these reviews, but I don’t think that will color the opinions I represent here, which were already positive from my first hours of tinkering with it (except, that is, in moments where I considered the hefty price tag). One obvious plus in Minitab’s favor is that the installer worked right off the bat, which wasn’t the case in Thank God I Chose SQL Server part I: The Tribulations of a DB2 Trial. In fact, I never did get Oracle’s installer to work at all in Thank God I Chose SQL Server part II: How to Improperly Install Oracle 11gR2, thanks to some Java errors that Oracle has chosen not to fix, rather than novice inexperience. Another plus is that the .chm Help section is crisply written and easy to follow even for non-experts, which is really critical when you’re dealing with the advanced statistical topics that can quickly become mind-numbing. I didn’t run into the kinds of issues I did with SSDM and WEKA in terms of insufficient documentation. I was also pleasantly surprised to find that Minitab installed more than 350 practice datasets out of the box, far more than any other analytics or database-related product I can recall seeing, although I rare use samples of this kind.
The Minitab GUI
At first launch, it is immediately obvious that spreadsheets are the centerpiece of the GUI, in conjunction with a text output window that centralizes summary data for of all worksheets when algorithms are run on them. That window can quickly become cluttered with data if you’re running a lot of different analyses in one session; I was also relieved to discover that this text-only format is supplemented by many non-text visualizations available as well, which I’ll cover in the next article. The user interface is obviously based on Microsoft’s old COM standard, not Windows Presentation Foundation (WPF), but it’s well-done for COM and definitely leaps and bounds ahead of the Java interfaces used in third-party mining suites like Oracle, DB2 and WEKA. Incidentally, Minitab has automation capabilities, but these are exposed through the old COM standard, which of course a lot more difficult to work with than .Net. Greater emphasis is placed on macros, which involves learning Session Commands that have an Excel-like syntax. Although I was generally pleased with the usability of the interface, there were of course a few issues, especially when I unconsciously expected it to behave like SQL Server Management Studio (SSMS). Sorting is really cumbersome in comparison, for instance. You have to go up to a menu and choose a Sort… command, then make sure it’s manually applied to every column if you want the worksheet synchronized; the sorted data then has to be placed into a new worksheet, none of which would fly in a SQL Server environment. Most of the action takes place in dialog windows brought up through menu commands, where end users are expected to select a series of worksheet columns and enter appropriate parameters. One pitfall is that typing constants into the dialog boxes is often a non-starter; most of the time you need to select a worksheet column from a list on the left side, which can be counter-intuitive in some situations. A lesser annoyance is that sometimes the columns to the left in the selection boxes are blank until you click inside a textbox, which makes you wonder sometimes if it is supposed to be greyed out to indicate unavailability. Another issue is that if you forget to change worksheets during calculations, Minitab will just dump rows from the table you’re doing computations on into whatever spreadsheet is topmost; as if to rub salt in our wounds, it’s not sorted either.
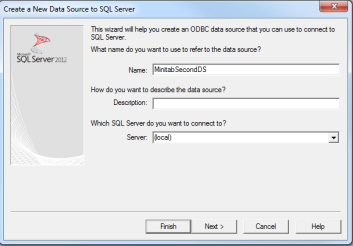
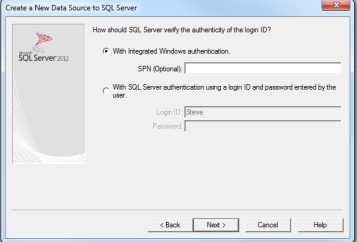
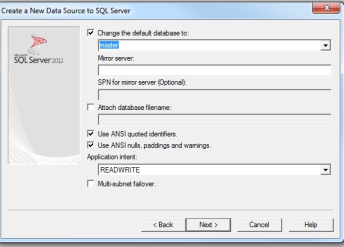
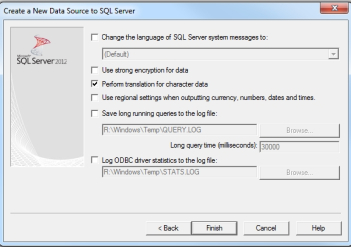
…………Minitab can import data from many sources, but in this series we’re specifically concerned with integrating it into a SQL Server environment. This is done entirely through ODBC; apparently Minitab also has Dynamic Data Exchange (DDE) capabilities, but I didn’t bother to try to connect through this old Windows 2000-era medium, which I haven’t used since I got my MCSD in Visual Basic 6. From the File Menu, choose Query ODBC Database… as shown in Figure 1. If you don’t have a file or machine DNS set up yet, you will have to click New… in the Select Data Source window shown in Figure 2. The graphic after that depicts six windows you’ll have to navigate through to create one, most of which is self-explanatory; you basically select a SQL Server driver type, an existing server name and the type of authentication, plus a few connection options like default database. Later in the process, you can test the connection in a window I left out for the sake of succinctness. There isn’t much going on here that’s terribly different from what we’re already used to with SQL Server; the only stumbling block I ran into was in the SQL Server Login windows in Figure 4, where I had to leave the Server SPN blank, just as I did in the DNS definition. I’m not up on Service Principal Names (SPNs), so there’s probably a sound reason I’m not aware for leaving them out in this case.
Figure 1: Using the Query Database (ODBC) Menu Command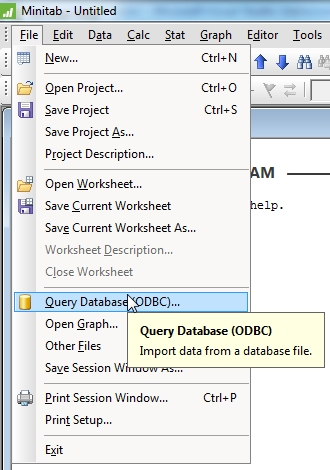
Figure 2: Selecting a DNS Data Source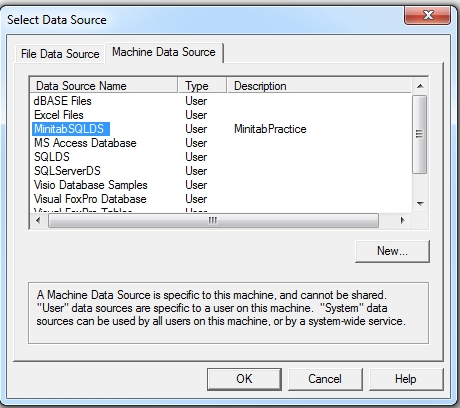
Figure 3: Six Windows Used to Set Up a SQL Server DNS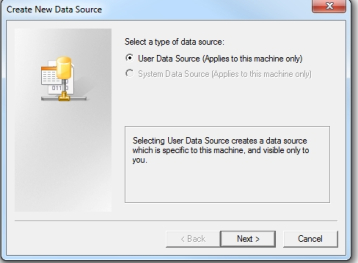
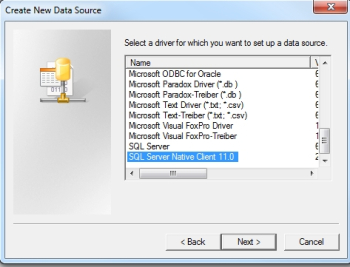
Figure 4: Logging in with SQL Server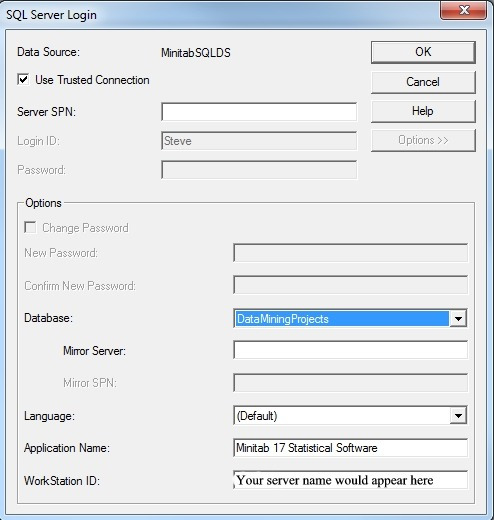
…………One of my primary concerns was that Minitab wouldn’t be able to display as many rows as SSMS, especially after WEKA choked on just 5,500 records in my first two tutorials. Naturally, one of the first things I did was stress-test it using the 11-million-row Higgs Boson dataset I’ve been using for practice data for the last couple of tutorial series, which originally came from the University of California at Irvine’s Machine Learning Repository and now takes up about 5 gigs in a SQL Server table. SSMS can handle it no problem on my wheezing old development machine, but I didn’t know what to expect, given than Minitab is not designed with “Big Data”-sized relational tables and cubes in mind. I was initially happy with how fast it loaded the first two float columns, which took about a minute in which mtb.exe ran on one core. Then I discovered that I couldn’t scroll past the 10 millionth row, although the distance to the end of the scrollbar was roughly proportional to the remaining million rows, i.e. about 10 percent. I then discovered the following limits in Minitab’s documentation, which SQL Server users might run into frequently given the size of the datasets we’re accustomed to:
“Each worksheet can contain up to 4000 columns, 1000 constants, and 10,000,000 rows. The total number of cells depends on the memory of your computer, up to 150,000,000. This worksheet size limit applies to each worksheet in a Minitab project. For example, you could have two worksheets in your project, each with 150 million cells of data. Minitab does not limit the number of worksheets you can have in a project file. The maximum number of worksheets depends on your computer’s memory.”[1]
…………It is often said that SSMS is not intended for displaying data, yet DBAs, developers and others often use it that way anyway; I would regard it as something of a marketing failure on Microsoft’s part not to recognize that and deliberately upgrade the interface, rather than trying to force customers into a preconceived set of use cases. Despite this inattention, SSMS still gets the job of displaying large datasets done much better than Minitab; this may be a feature that I just happen to notice more due to the fact that I’m used to using SQL Server for data mining purposes, not the more popular use case of serving high transaction volumes. Performance comparisons of the calculation speed and resource usage during heavy load are more appropriate and in this area, Minitab did better than expected. I wouldn’t use it to mine models of the size I used in the Rickety series, let alone terabyte-sized cubes, but it performed better than I expected on datasets of moderate size. Keep in mind, however, that it lacks almost all of the tweaks and options we can apply in SQL Server, like indexing, server memory parameters, dynamic management views (DMVs) to monitor resource usage, tools like Resource Governor and Profiler – you name it. That’s because SQL Server is designed to meet a different set of problems that only overlap Minitab at certain points, mainly in the data mining field.
…………Comparisons of stability during mining tasks are also more appropriate and in this respect, Minitab fared better than any of competitors of SSDM I’ve tried to date. Despite being an open source tool, WEKA turned out to be more stable than DB2 and Oracle, but I’m not surprised that Minitab outclassed them all, given that all three are written in clunky Java ports to Windows. I had some crashes while using certain computationally intensive features, particularly while performing variations of ANOVA. One error on a simple one-way ANOVA and another while using Tukey’s multiple comparison method forced me to quit Minitab. A couple of these were runtime exceptions on Balanced ANOVA and Nested ANOVA tasks that didn’t force termination of the program. I encountered a rash of errors towards the end of the trial, including a plot that seized up Minitab and a freeze that occurred while trying to select from the Regression menu. One of these occasions, I tried to kill the process in Task Manager, only to discover that I couldn’t close any windows at all in Explorer for a couple of minutes (there was no CPU usage, disk errors or other such culprits in this period, which was definitely triggered by the Minitab error). Perhaps the most troubling problem I encountered towards the end was increasingly lengthy delays in loading worksheets with a couple of hundred columns, but only about 1,500 rows; these were on the order of four or five minutes apiece, which is unacceptable. Overall, however, Minitab performed better and was more stable than any other mining tool I’ve used to date, except SSDM. The two tools are really designed for tangential use cases though, with the first specializing in statistical analysis and lower-level mining algorithms like regression, while SSDM is geared more towards serious number-crunching on large datasets, using higher-level mining methods like neural nets.
Weak Data Types but Unique Functions
That explains why Minitab doesn’t hold a candle to SQL Server in terms of the range of its data types, which may become an issue in large datasets and calculations where high precision makes sense. Worksheets can only hold positive or negative numbers to a maximum of 1018 in either direction, beyond which the values are tagged as missing and an error is raised.[2] It is possible to store values up to 80 decimal places long in the spreadsheet (scientific notation is not automatically invoked), but they may be treated as text, not numbers. The Fixed Decimal dialog box only allows users to select up 30 decimal places. Worse still, only 17 digits can be entered to the left or right before truncation begins, whereas SQL Server’s decimal and numeric types can go as high as 38. Our floats can handle up to 308 decimal places – which sounds like overkill, until you start translating common statistical functions for use on mining large datasets and quickly exhaust all of this extra slack. The existing SQL Server data types are actually inadequate for implementing useful data mining algorithms on Big Data-sized models – so where does that leave Minitab, where the permissible ranges are an order of magnitude smaller? Incidentally, another possible source of frustration with Minitab’s data type handling is its lack of an equivalent to identity columns; the same functionality can only be implemented awkwardly, through such methods as manually setting the same sort options for each column in a worksheet.
…………At present, I’m trying to acquire the math skills to translate statistical formulas into T-SQL, Visual Basic and Multidimensional Expressions (MDX), which in some cases can be done more efficiently in SQL Server. This DIY approach can take care of some of the use cases in between SQL Server’s and Minitab’s respective spheres of influence, but as the sophistication of the stats begins to surpass a developer’s skill levels, the balance increasingly leans towards Minitab. One area where home-baked T-SQL solutions have the advantage is in terms of the mathematical functions and constants that Minitab provides out-of-the-box. It has pretty much the same arithmetic, statistical logical, trigonometric, logarithmic, text and date/time functions that SQL Server and Common Language Runtime (CLR) languages like Visual Basic and C# do, except that our versions have much higher precision. It is also trivial to use far more precise values of Pi and Euler’s Number in T-SQL than those provided in Minitab. On top of that, it is much easier to use one of the functions inside a set-based routine than it is to type it into a spreadsheet, which opens up a whole world of possibilities in SQL Server that simply cannot be done in Minitab. There are Excel-like commands to Lag, Rank and Sort data, but they don’t hold a candle to T-SQL windowing functions and plain old ORDER BY statements.
…………Minitab provides a few functions that aren’t available out-of-the-box with SQL Server, but even here, the advantage resides with T-SQL solutions. It is trivial to implement stats like the sum of squares and geometric mean in T-SQL, where we have fine-grained control and can leverage our knowledge of all of SQL Servers’ internal workings for better performance and encapsulation; a DBA can do things like write queries that do a single index scan and then calculate two similar stats from it afterwards at trivial added cost, but that’s not going to happen in statistical packages like Minitab. This is true even in terms of advanced statistical tests where Minitab’s implementation is probably the better choice; their Kolmogorov-Smirnov Test is certainly better than the crude attempt I’ll post in my next series, but you’re not going to be able to calculate Kuiper’s Test alongside it in a sort of two-for-the-price-of-one deal like I’ll do in that tutorial. In general, it is best to trust to Minitab for such advanced tests unless there’s a need for tricks of that kind, but to use T-SQL solutions when they’d be easy to write and validate. Some critical cases in point include Minitab’s Combinations, Permutations and Gamma functions, which are severely restricted by the limitations of their data types. At 170 records, I was only able to get permutations and combinations results when I used a k value no higher than 8, but it only took me a couple of minutes to write T-SQL procedures that leveraged the size of SQL Server’s float data type to top out at 168 k. I was likewise able to write a factorial function that took inputs up to 170, but Minitab’s version only goes up to 19. In the same vein, their gamma function only accepts inputs up to 20. These limitations might not cut it for some statistical and data mining applications with high values or record counts; as I’ve found out the hard way over the last couple of tutorial series, some potentially useful algorithms and equations can’t even be implemented at all in many mainstream languages because they require permutations and other measures that are subject to combinatorial explosion. There are still a few Minitab functions I haven’t tried to implement yet, like Incomplete Gamma, Ln gamma, MOD, Partial Product, Partial Sum, Transform Count and Transform Population, in large part because they have narrower use cases I’m not familiar with, but I suspect the same observations hold there.
…………As the sophistication of the math under the hood increases, the balance shifts to Minitab over T-SQL solutions. For example, all of the probability functions I’ll code in T-SQL for my series Goodness-of-Fit Testing with SQL Server are provided out-of-the-box in Minitab 17, including probability density functions (PDFs), cumulative distribution functions (CDFs), inverse cumulative distribution functions and empirical distribution functions (EDFs) for many more distributions beside the Gaussian normal I was limited to. These include the Normal, Lognormal, 3-parameter lognormal, Gamma, 3-parameter gamma Exponential, 2-parameter exponential, Smallest extreme value Weibull, 3-parameter Weibull Largest extreme value Logistic, Loglogistic and 3-parameter loglogistic, which are the same ones available for Minitab probability plots. There is something to be said for coding these in T-SQL if you run into situations where higher precision data types, indexing, execution plans and the efficiency of windowing functions can make a difference, but for most use cases, you’re probably off depending on the proven quality of the Minitab implementation. In fact, Minitab implements many of the same goodness-of-fit tests I’ll be covering in that series, like the Anderson-Darling, Kolmogorov-Smirnov, Ryan-Joiner, Chi-Squared, Poisson and Hosmer-Lemeshow, as well as the Pearson correlation coefficient. You’re probably much better off depending on the proven quality of their versions than taking the risk of coding your own – unless, of course, you have a special need for higher-precision results for Big Data scenarios, as my mistutorial series demonstrated how to implement.
Figure 5: The Stat Menu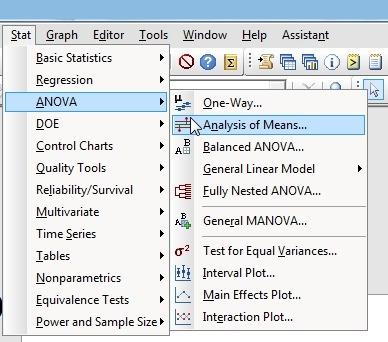
…………That is doubly true when we’re talking about even more complex calculations, such as ANOVA tests, which are accessible from the Stat menu. Analysis of variance is only tangentially related to data mining per se, but its output can be useful in shedding light on the data from a different direction; to make a long story short, variance is partitioned in order to provide insight into the reasons why the mean values of multiple datasets differ. As depicted in Figure 5, Minitab includes many of most popular tests, like Balanced, Fully Nested, General and One-Way ANOVA, plus One Way Analysis of Means and a Test for Equal Variances; I’ve tried to code a couple of these myself and can attest that they’re around that boundary where a professional tool begins to make more sense than DIY T-SQL solutions. Some of the tests on the Nonparametrics submenu, like Friedman, Kruskal-Wallis, Mann-Whitney and the like, are fairly easy to do in T-SQL, as are some of the Equivalence Tests. A couple of routines are available to force data into a Gaussian or “normal” distribution, like the Box-Cox and Johnson Transformation, but I don’t have any experience with using them, let alone coding them in T-SQL. Minitab also has some limited matrix math capabilities available through other menus, but I’m on the fence so far as to whether I’d prefer a T-SQL or .Net solution for these. The Basic Statistics menu features stats that are easy to code or come out-of-the-box in certain SQL Server components, like variance, correlation, covariance and proportions, but it also has more advanced ones like Z and T tests, outlier detection and normality testing functions. There are also some related specifically to the Poisson distribution. The Table menu is home to the Chi-Square Test for Association and Cross-Tabulation, each of which isn’t particularly difficult to code in T-SQL either; the time, skills and energy required to program them all yourself begins to mount with each one you develop a need for though, till the point is eventually reached where Minitab (or perhaps one of its competitors) begins to justify its cost.
…………Minitab really shines in the area of stats for specific engineering applications, like reports and templates for Six Sigma engineering, plus separate sections in Help explaining in-depth how to use the Reliability and Survival Analysis and Quality Process and Improvement functionality on the Stat menu. The documentation for Design of Experiments (DOE) is excellent as well. This functionality is accessible through the DOE item on the Stat menu, which allows you to perform such helpful tasks as gauging how many records are required to meet your chosen confidence levels. Various factorial, mixture, Taguchi and response surface DOE designs are available. I’m not familiar with either DOE or these engineering applications, so I’d definitely use a third-party tool for these purposes instead of coding them in SQL Server or .Net. Some of the individual items on these menus include Distribution Analysis, Warranty Analysis, Accelerated Life Testing, Probit Analysis, Gage Study and Attribute Agreement Analysis, all of which are highly specialized. Most of the meat and potatoes in the program can be found on Stat menu, but the Assistant menu also provides access to many prefabricated workflows that can really save a lot of time and hassle. In fact, I was able to learn something about the function of Capability Analysis and Measurement Systems Analysis just by looking at the available options on these workflows. The Regression Assistant is directly relevant to data mining, while the workflows for certain other activities like planning and interpreting experiments might prove just as useful. The hypothesis testing workflow in Figure 6 would probably come in handy for statistical tasks that are complementary to data mining.
Figure 6: The Hypothesis Testing Assistant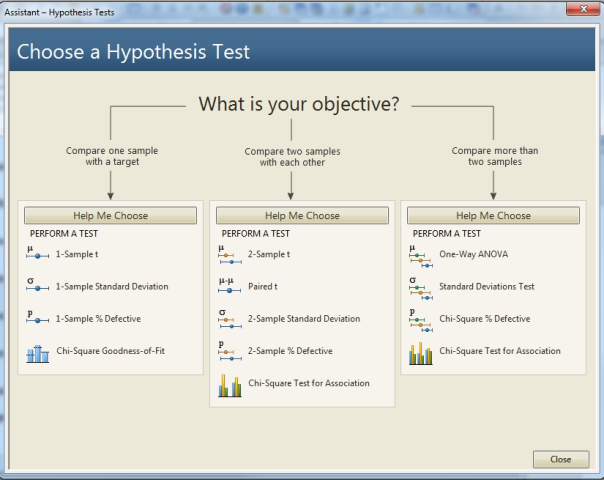
…………The Graphical Analysis Assistant also helps centralize access to many of the disparate visualizations scattered throughout the GUI, like probability plots, histogram windows, contour plots, 3D surface plots and the like. Normally, these open up in separate windows when a task from the Stat menu is run. I’ll cover these in the next installment and address the question of whether or not it is better off buying an off-the-shelf functionality like this, or developing your own Reporting Services solutions in-house. All of these visualizations can be coded in SQL Server – with the added benefit that RS reports can be customized, which is not the case with their Minitab counterparts. I’ll also delve into some of the Stat menu items that overlap SSDM’s functionality, like Regression and Time Series. Minitab features a wider range of clustering algorithms than SSDM, which are accessible from the Multivariate item. This item also includes Principle Components Analysis, Factor Analysis, Item Analysis and Discriminant Analysis, none of which I’m familiar enough with to code myself; the inclusion of principle components, for example, in data mining workflows is justified by the fact it’s useful in selecting the right variables for analysis. I have no clue as to what Minitab’s competitors are capable of yet, but after my experience with it I’d definitely use a third-party tool in this class for tasks like this, plus hypothesis testing, ANOVA and DOE. Some of the highly specific engineering uses are beyond the use cases that SQL Server data miners are likely to encounter, but should the need arise, there they are. As with WEKA, Minitab’s chief benefits in a SQL Server environment are its unique mining algorithms, which I’ll introduce in a few weeks.
[1] See the Minitab webpage “Topic Library / Interface: Worksheets” at http://support.minitab.com/en-us/minitab/17/topic-library/minitab-environment/interface/the-minitab-interface/worksheets/
[2] See the Minitab webpage “Numeric Data and Formats” at http://support.minitab.com/en-us/minitab/17/topic-library/minitab-environment/data-and-data-manipulation/numeric-data-and-formats/numeric-data-and-formats/


