SQL server 2014 is very slow
-
May 26, 2017 at 9:27 pm

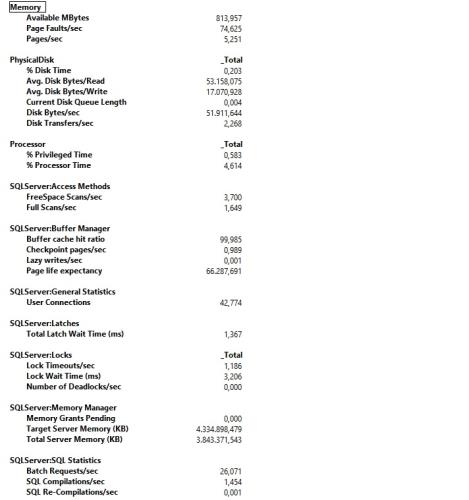
Based on this report(performance monitor) can any one tell why the Sql server is running slow. many application have slow performance.. What could be the reason and what would be probable solution to overcome this slowness
-
May 27, 2017 at 6:43 am
Nope, nothing useful there.
Most of those counters are only useful if you know what normal is for that server and workload and are looking for the difference from normal.Usual process, look at wait stats (change over an hour or two at the most, not the total since SQL started), identify the slow queries, tune then.
Gail Shaw
Microsoft Certified Master: SQL Server, MVP, M.Sc (Comp Sci)
SQL In The Wild: Discussions on DB performance with occasional diversions into recoverabilityWe walk in the dark places no others will enter
We stand on the bridge and no one may pass -
May 29, 2017 at 1:06 am
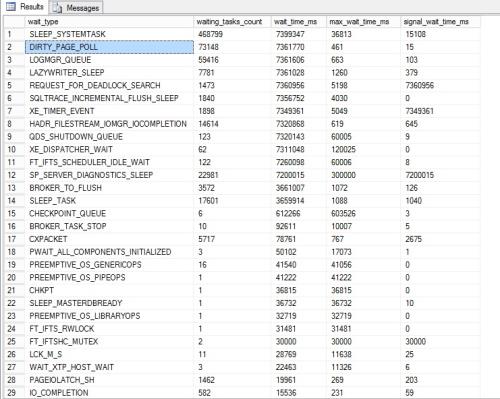
These are the wait type

These query are in execution. So how to find the issue for slow performance.

total memory use:
SELECT (physical_memory_in_use_kb/1024) AS Used_Memory_By_SqlServer_MBFROM from sys.dm_os_process_memory
--1024
So how to understand what is the real bottleneck.? -
May 29, 2017 at 1:19 am
I didn't say look at the queries currently executing, and are those the waits over max an hour of busiest time? Can you filter the meaningless waits out and post the results in some form other than a screenshot?
Usual process, look at wait stats (change over an hour or two at the most, not the total since SQL started), identify the slow queries, tune them.
Old, but still mostly valid: https://www.simple-talk.com/sql/performance/finding-the-causes-of-poor-performance-in-sql-server,-part-1/Gail Shaw
Microsoft Certified Master: SQL Server, MVP, M.Sc (Comp Sci)
SQL In The Wild: Discussions on DB performance with occasional diversions into recoverabilityWe walk in the dark places no others will enter
We stand on the bridge and no one may pass -
May 29, 2017 at 3:48 am
I am pasting it in different format for your perusal.
Wait type Wait task Counts Wait time ms max wait time ms signal Wait time ms CLR_AUTO_EVENT 9 24679190 12338620 12 SLEEP_SYSTEMTASK 1353731 21277296 36813 49157 QDS_SHUTDOWN_QUEUE 355 21240403 60006 17 DIRTY_PAGE_POLL 211118 21240224 461 103 LOGMGR_QUEUE 170639 21239835 663 342 LAZYWRITER_SLEEP 22448 21238167 1260 1034 REQUEST_FOR_DEADLOCK_SEARCH 4248 21237093 5198 21237093 SQLTRACE_INCREMENTAL_FLUSH_SLEEP 5309 21234018 4030 1 XE_TIMER_EVENT 5483 21224773 5049 21224773 HADR_FILESTREAM_IOMGR_IOCOMPLETION 42315 21199097 627 2233 XE_DISPATCHER_WAIT 177 21111024 120025 0 FT_IFTS_SCHEDULER_IDLE_WAIT 351 21000328 60038 64 SP_SERVER_DIAGNOSTICS_SLEEP 51554 21000047 300001 21000047 CHECKPOINT_QUEUE 152 20841451 11692551 271 SLEEP_TASK 48336 10601426 1107 2873 BROKER_TO_FLUSH 10343 10599909 1102 437 ASYNC_NETWORK_IO 34842 4527554 2023 5614 -
May 29, 2017 at 4:00 am
Are those the waits over max an hour of busiest time?
Or is that just an unfiltered query again os_wait_stats?Gail Shaw
Microsoft Certified Master: SQL Server, MVP, M.Sc (Comp Sci)
SQL In The Wild: Discussions on DB performance with occasional diversions into recoverabilityWe walk in the dark places no others will enter
We stand on the bridge and no one may pass -
May 29, 2017 at 5:00 am
I have filtered it only those where wait time is more than 1hr. What is the probable cause of slow performance.
wait_type waiting_tasks_count wait_time_ms max_wait_time_ms signal_wait_time_ms SLEEP_SYSTEMTASK 1997420 31385945 36813 88802 DIRTY_PAGE_POLL 311603 31349282 461 183 LOGMGR_QUEUE 252681 31348760 663 566 REQUEST_FOR_DEADLOCK_SEARCH 6270 31347932 5198 31347932 LAZYWRITER_SLEEP 33125 31346345 1260 1881 SQLTRACE_INCREMENTAL_FLUSH_SLEEP 7836 31342922 4030 2 XE_TIMER_EVENT 8095 31334544 5049 31334544 QDS_SHUTDOWN_QUEUE 523 31320582 60006 26 XE_DISPATCHER_WAIT 262 31310998 120025 0 HADR_FILESTREAM_IOMGR_IOCOMPLETION 62492 31308180 627 4081 SP_SERVER_DIAGNOSTICS_SLEEP 65512 31200050 300003 31200050 FT_IFTS_SCHEDULER_IDLE_WAIT 518 31020508 60038 106 CHECKPOINT_QUEUE 159 26884637 11692551 272 CLR_AUTO_EVENT 9 24679190 12338620 12 ASYNC_NETWORK_IO 57590 15746274 2080 8662 SLEEP_TASK 73940 15656874 1107 4566 BROKER_TO_FLUSH 15274 15655187 1102 922 -
May 29, 2017 at 7:46 am
That is not what I asked for. Please read what I'm asking.
Filter out the meaningless waits. There are plenty of references online as to which ones are not important. Start with Glenn Berry's scripts.
Get the waits over an hour or two interval, at most, during busy and/or slow times. The cumulative waits since SQL started, which is what you're posted multiple times now, are nearly useless because there's too much noise.And did you read the article I referenced?
Gail Shaw
Microsoft Certified Master: SQL Server, MVP, M.Sc (Comp Sci)
SQL In The Wild: Discussions on DB performance with occasional diversions into recoverabilityWe walk in the dark places no others will enter
We stand on the bridge and no one may pass -
May 29, 2017 at 3:01 pm
Another train of thought:
1 - how much CPU/RAM does the system have?
2 - when did the slowdown first become noticable? Has it always been slow or is it gradually getting worse?
3 - how frequently do you update statistics and rebuild/reorganize indexes?
4 - how much memory is the max memory for SQL vs how much is the total memory for the system?
5 - how frequently does it autogrow and (heaven forbid) autoshrink?
6 - do you manually shrink the database?
7 - are the slow applications in house or 3rd party?
7b - if they are 3rd party, have you contacted support?I would follow Gail's advice, but just a few other things to throw into the "why is it slow" troubleshooting pot.
I'd recommend hiring a consultant. They are experts in their field. They will be a lot faster and more focused support than a free forum.That being said, your available MB in your first screenshot looks a tad low. I imagine putting more RAM into the system and/or configuring the max memory for SQL will have a noticable benefit.
The above is all just my opinion on what you should do.
As with all advice you find on a random internet forum - you shouldn't blindly follow it. Always test on a test server to see if there is negative side effects before making changes to live!
I recommend you NEVER run "random code" you found online on any system you care about UNLESS you understand and can verify the code OR you don't care if the code trashes your system. -
May 31, 2017 at 1:16 am
Max memory is set to 4096 MB.Auto growth is set to 10%.Manually shrinking of the data base is being done.
RAM is 6GB and in task manager it is showing 50% is usage but the windows admin is saying RAM usage is 25%.
10% of the CPU is being utilised
What wait type is causing the problem . What is solution for this? any kind of assistance is really appreciable.
Thanks all of you for responding and viewing the use
-
May 31, 2017 at 1:26 am
pranabpal - Wednesday, May 31, 2017 1:16 AMMax memory is set to 4096 MB.Auto growth is set to 10%.Manually shrinking of the data base is being done.RAM is 6GB and in task manager it is showing 50% is usage but the windows admin is saying RAM usage is 25%.
10% of the CPU is being utilised
What wait type is causing the problem . What is solution for this? any kind of assistance is really appreciable.
Thanks all of you for responding and viewing the use
Two things immediately stand out. First don't set your autogrowth to be a percentage, set it at a fixed size e.g 512MB. Secondly why are you shrinking your database? Please don't do this as it is unnecessary and will fragment you indexes and cause performance problems.
Thanks
-
May 31, 2017 at 1:28 am
pranabpal - Wednesday, May 31, 2017 1:16 AMMax memory is set to 4096 MB.Auto growth is set to 10%.Manually shrinking of the data base is being done.RAM is 6GB and in task manager it is showing 50% is usage but the windows admin is saying RAM usage is 25%.
10% of the CPU is being utilised
What wait type is causing the problem . What is solution for this? any kind of assistance is really appreciable.
Thanks all of you for responding and viewing the use
Did you miss the (heaven forbid) part? Autoshrink fragments your indexes to make the database smaller. REALLY bad idea. Turn that OFF.
-
May 31, 2017 at 2:30 am
pranabpal - Wednesday, May 31, 2017 1:16 AMMax memory is set to 4096 MB.Auto growth is set to 10%.Manually shrinking of the data base is being done.RAM is 6GB and in task manager it is showing 50% is usage but the windows admin is saying RAM usage is 25%.
10% of the CPU is being utilised
What wait type is causing the problem . What is solution for this? any kind of assistance is really appreciable.
Thanks all of you for responding and viewing the use
Use activity monitor or Perfmon to get accurate value of memory usage .
What your DB is for ?
Is it used heavily?
Did you check for blocking or deadlocks?
Are you observing slowness all the time or at any particular time?As Gail said observe your server and filter out the most used queries or waits.
Enable Data collection which will help pinpoint the issues. -
May 31, 2017 at 3:40 am
pranabpal - Wednesday, May 31, 2017 1:16 AMWhat wait type is causing the problem . What is solution for this?I don't know, because you still haven't posted what I've asked for multiple times.
Get a script that filters out the useless waits
Save the wait information to a table every hour
Work out the differences between two sample periods (in busy times) and post that (the top 25 useful ones, not the whole list)Gail Shaw
Microsoft Certified Master: SQL Server, MVP, M.Sc (Comp Sci)
SQL In The Wild: Discussions on DB performance with occasional diversions into recoverabilityWe walk in the dark places no others will enter
We stand on the bridge and no one may pass -
May 31, 2017 at 3:43 am
pranabpal - Wednesday, May 31, 2017 1:16 AMMax memory is set to 4096 MB.Auto growth is set to 10%.Manually shrinking of the data base is being done.RAM is 6GB and in task manager it is showing 50% is usage but the windows admin is saying RAM usage is 25%.
10% of the CPU is being utilised
What wait type is causing the problem . What is solution for this? any kind of assistance is really appreciable.
Thanks all of you for responding and viewing the use
4GB isn't much more than the minimum required for SQL Server to function properly. Expect dire performance.
Get more RAM.“Write the query the simplest way. If through testing it becomes clear that the performance is inadequate, consider alternative query forms.” - Gail ShawFor fast, accurate and documented assistance in answering your questions, please read this article.
Understanding and using APPLY, (I) and (II) Paul White
Hidden RBAR: Triangular Joins / The "Numbers" or "Tally" Table: What it is and how it replaces a loop Jeff Moden
Viewing 15 posts - 1 through 15 (of 49 total)
You must be logged in to reply to this topic. Login to reply


