OK, so maybe they do not lie to you, but I got your attention. In virtualized environments, the performance statistics that you see from the management interface may not give you the entire picture, and can lead to bad assumptions or misleading recommendations.
Remember, the virtualization layer does not understand the nuances of the applications that you are running inside the virtual machine, so it might be giving you performance statistics that are not representative of that application.
For example, SQL Server is very memory hungry, as it uses memory to cache data reads from disk. If you give a SQL Server virtual machine 32GB of vRAM, and allocate 26GB to the SQL Server buffer pool, chances are that all 26GB is going to get consumed as your workload reads data. However, the physical host server where your VM is running might not understand this usage pattern, and might misinterpret things.
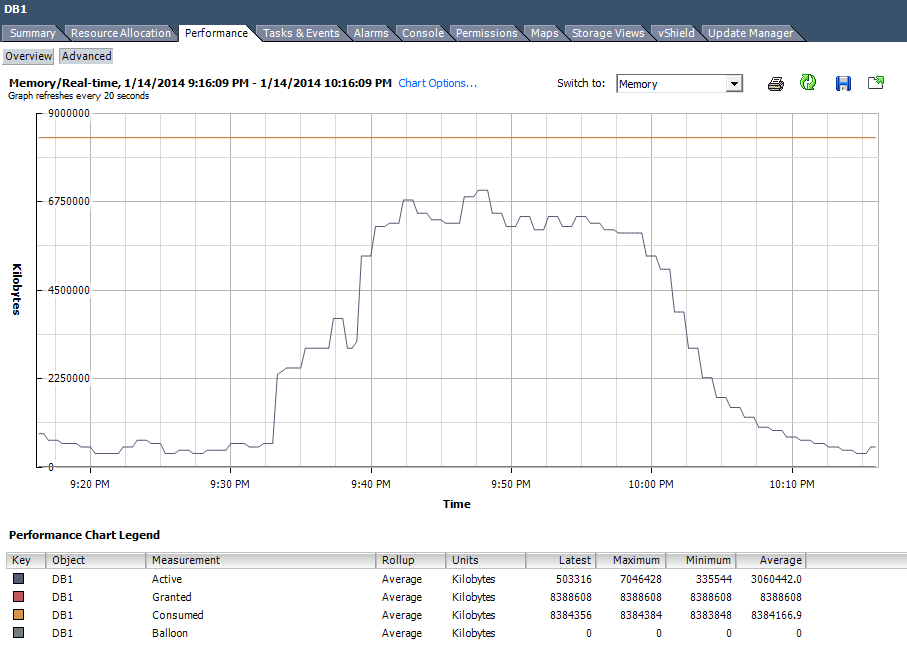
Take this scenario. I recently had to load a 20GB dataset into a SQL Server for performance statistic analysis. The data is read from disk and inserted into a new SQL Server table. At the end of the load, and because nothing else was running on that server at the time of the load, almost all of the inserted data was also now in the buffer pool. But, look at what the VMware performance counters for memory for this virtual machine reported.
You’ll notice that the active memory counter grows as the data is loaded. Once the data is loaded, however, the data resides in the buffer pool, but VMware is reporting that the memory is no longer active as the timer on the block deltas grows. During this time, I am actively performing the analysis of the data, so the data is still being read from, but just does not change. This activity is not reflected in the counter at all.
It’s not just memory either. LogicMonitor has a great writeup of the differences between Windows Perfmon sampling inside a VM versus the actual CPU usage, as reported by the physical server.
I have heard virtualization administrators tell DBAs that because these counters show that most of the memory is stale and not active, it’s OK for them to reduce the amount of memory allocated to that virtual machine. This counter is pretty misleading, and I see quite a bit of misinterpretation by virtualization administrators on this topic. Now, they should not be expected to know the specifics on the workloads executing in their environments, but understanding that this counter does not show you the entire picture is going to save everyone a lot of time during these types of discussions.
As a result, this disparity is just one of the reasons why I constantly push the process of actively collecting ongoing performance statistics from both the physical host and from inside the guest, as well as from within the application that you have running inside the VM. Correlate everything together to see the full picture of what is going on, because any single metric probably does not give you the complete picture.
UPDATE: Mark Achtemichuk (t) from VMware has previously written a great blog post on vmware.com discussing this exact topic, and he goes into greater detail on the counter. You should go check it out here!


