Lets start New Year with a very simple yet useful topic.
I am a big fan of out of box reporting capabilities of SSMS. Some of the reports are really useful.
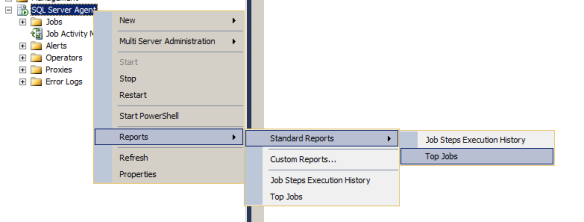
One of the reports which I really like is the Top Jobs report. This one can be pulled by traversing through -
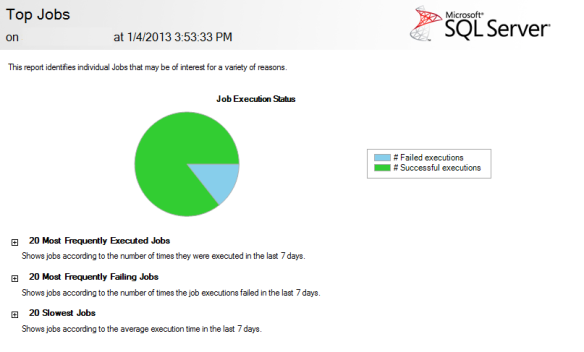
The report comes in really neat with a graph and 3 major information related to SQL agent jobs.
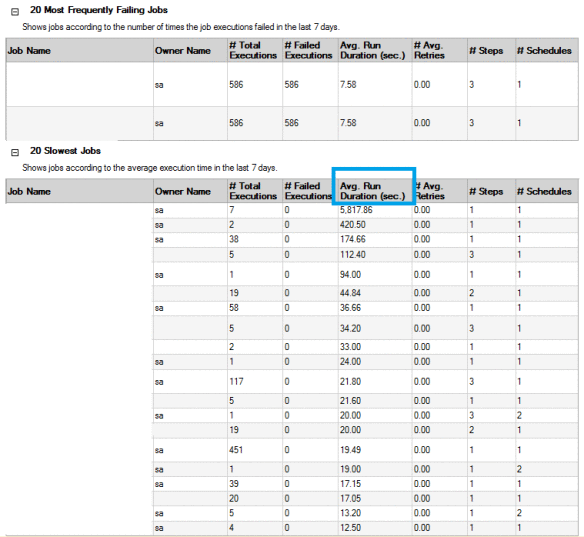
The ones which I’m really interested all the time are 20 Most Frequently Failing Jobs and the 20 Slowest jobs.
This information is very important for me as I can trend the job information over a period of time(Even though its for a weeks time) for the most business critical servers.
The reports provide lot of useful information such as Avg Run Duration,Total Executions etc which will help you to observe how jobs are behaving under normal circumstances and can even use this as a baseline. Pretty neat stuff out there.
We also have the Job steps execution history report which will provide us with information regarding various steps within the job. Again a useful one if you are having lot of steps which are configured for the same job.
Now lets look at a scenario – Your server is hitting 100% CPU and you believe that a heavy SQL job running at that point of time might be a reason for this spike.
How do you check which SQL job is running at that very point of time? Well, there are multiple ways to accomplish this. A TSQL code which joins couple of job related MSDB tables can quickly pull this information for you.
What if there is a light weight tool sitting right inside SSMS which can pull that information for you, lets look at that right away
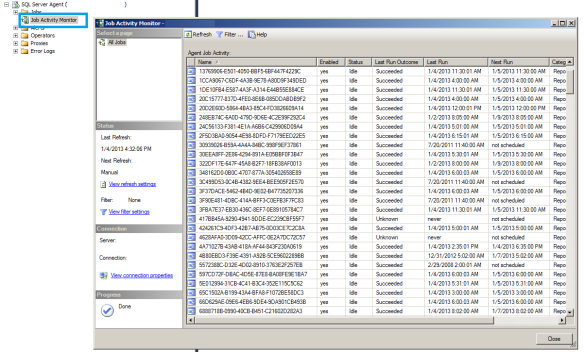
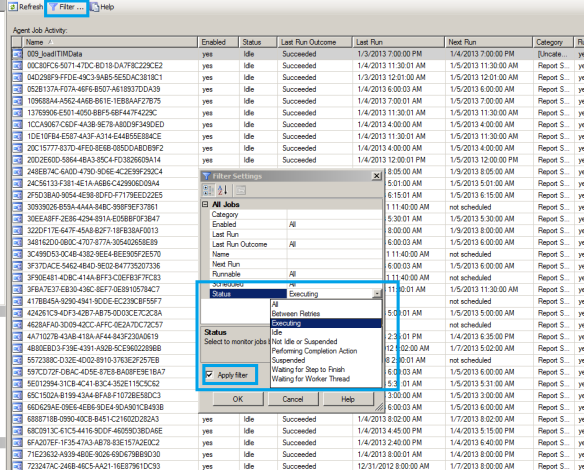
Job Activity Monitor option will help you to monitor SQL jobs real-time.
If you need to know about jobs which are executing right now, then you will need to use the filter option and apply the required status.
Conclusion
There are multiple ways to monitor your jobs and its statistics, however the above mentioned methods are simple and efficient to get a quick view of SQLAgent jobs and related information.


