Introduction
Have you ever been asked for information you couldn't provide because you didn't have an historical monitoring tool? Try this light weight technique which records high level performance statistics for both SQL Server and SQL Server databases.
Technique
- Select a SQL Server instance and database to host the data. I used one of our development servers and called my database SrvStat.
- Create two tables; one for server statistics and one for database statistics: See the CreateTables.sql in the resources section at the bottom.
3. Create a DTS package to transfer data from the servers you want to monitor into these tables using the following queries. I created one DTS for server monitoring and one for database monitoring:
- For server monitoring (You can add as many source servers as you choose. The process is the same for each.)
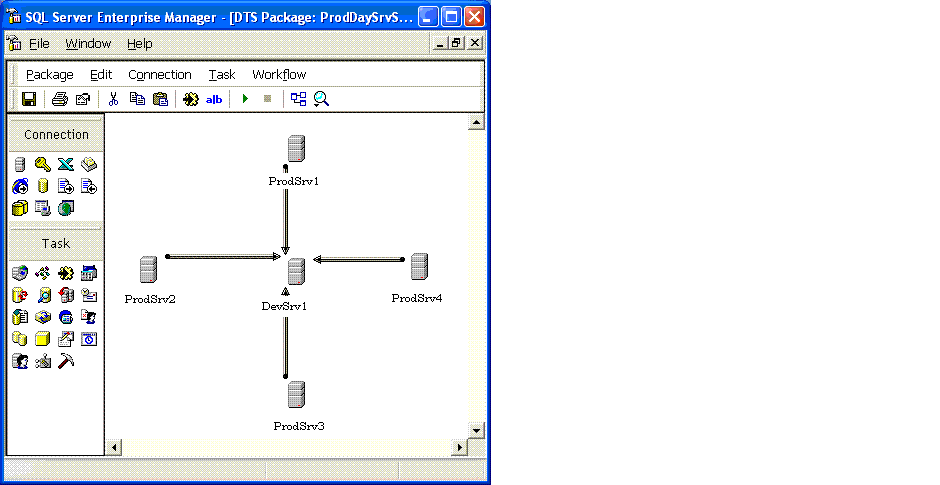
Each transform task contains the counters that you need in a query.
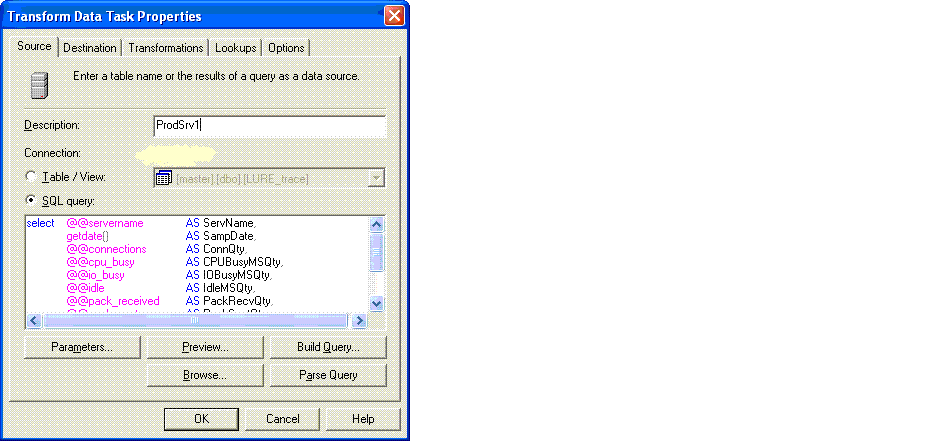
- Query Excerpt: (These counters are cumulative and are reset to zero when SQL Server is restarted).
select @@servername AS ServName,
 getdate() AS SampDate,
 @@connections AS ConnQty,
 @@cpu_busy AS CPUBusyMSQty,
 @@io_busy AS IOBusyMSQty,
 @@idle AS IdleMSQty,
 @@pack_received AS PackRecvQty,
 @@pack_sent AS PackSentQty,
 @@packet_errors AS PackErrQty,
 @@total_read AS TotReadQty,
 @@total_write AS TotWriteQty,
 @@total_errors AS TotIOErrQty
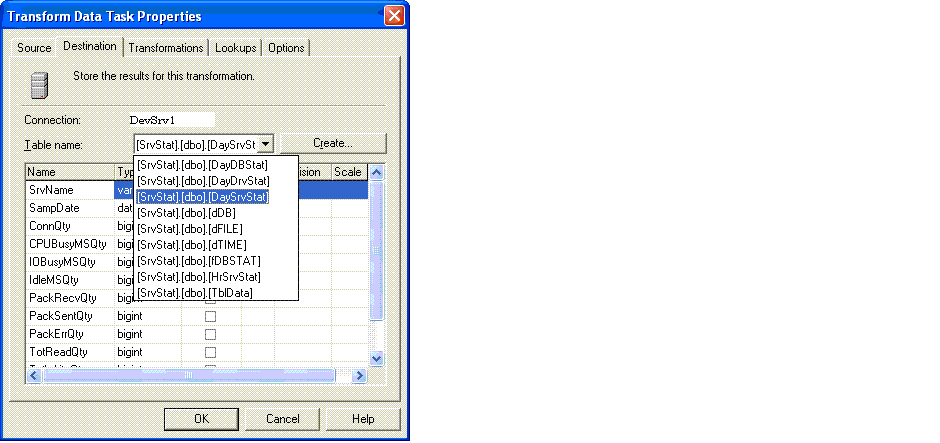
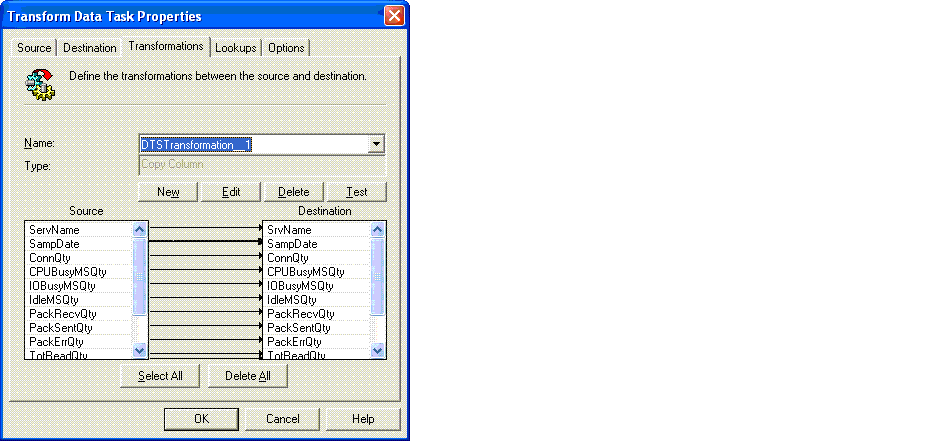
- For database monitoring (You can add as many source servers as you choose. The process is the same for each.)
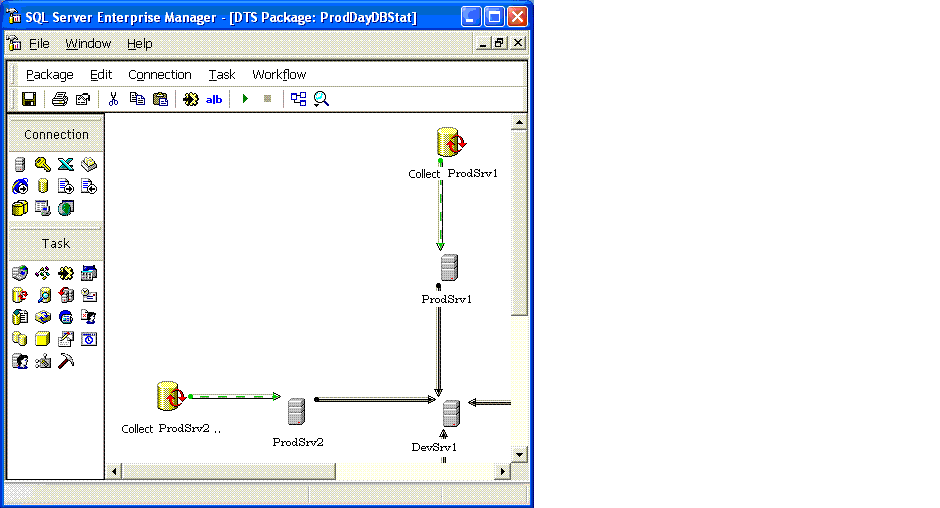
As you can see we are making simple transforms of each set of data.
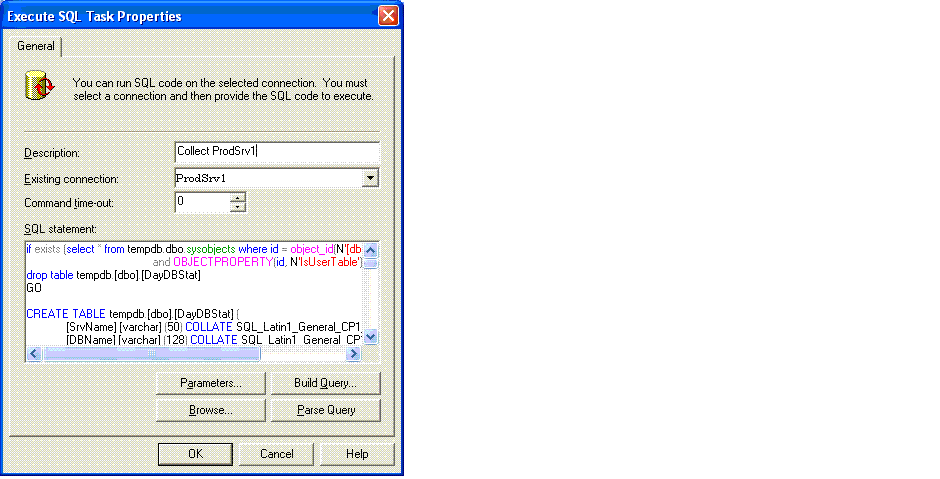
- Script Excerpt: (::fn_virtualfilestats is cumulative and are reset to zero when SQL Server is restarted)
The code for this section is in the Resources section as MonitoringServers.sql
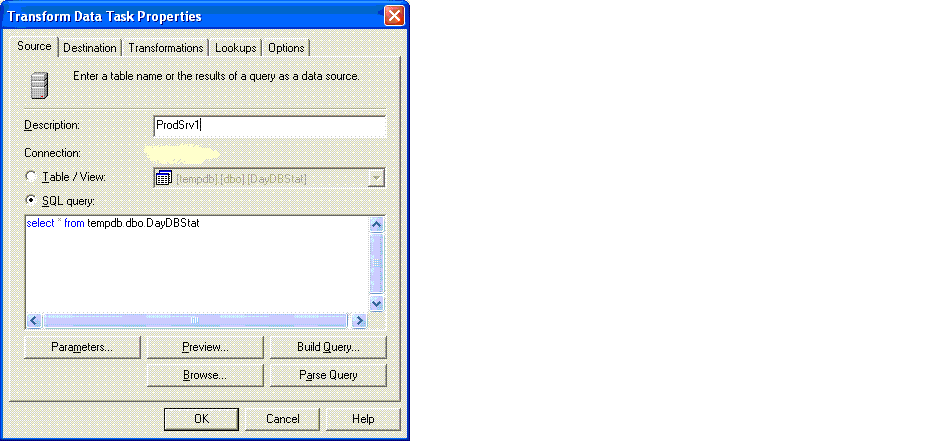
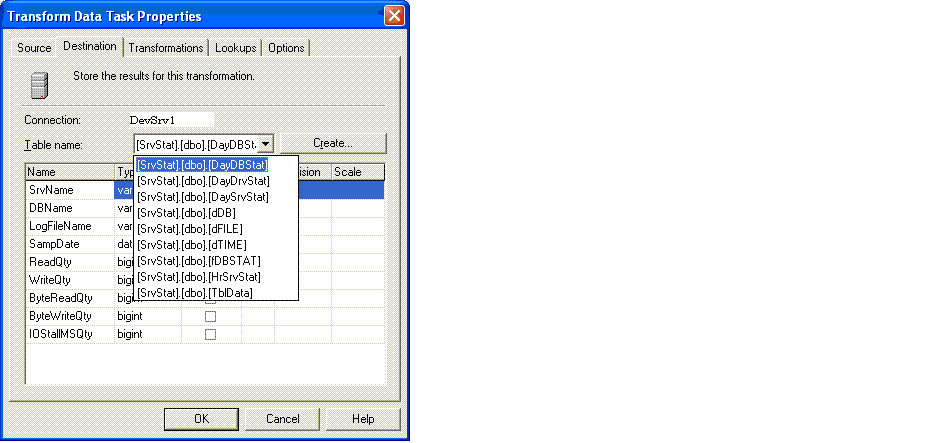
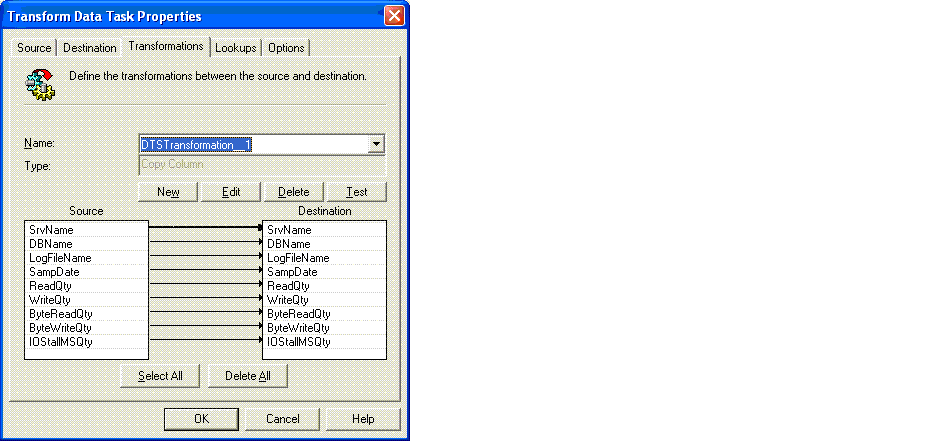
4. Schedule each package to run on a fixed schedule each day.
5. Since the counters listed above are cumulative, create the following two views (one for each base table) to break the data down to the interval you have chosen (daily in our case). Basically, these views subtract the previous row's counters from the current row to get a time interval total. (This code is in the Resources section as MonitoringServers2.sql).
-- Database stats
create view vDayDBStat
as
select top 100 percent d2.SrvName,
 d2.DBName,
 d2.LogFileName,
 d2.SampDate,
 case
 when d1.ReadQty > d2.ReadQty then d2.ReadQty
 when d1.ReadQty <= d2.ReadQty then d2.ReadQty - d1.ReadQty
 end as ReadQty,
 case
 when d1.WriteQty > d2.WriteQty then d2.WriteQty
 when d1.WriteQty <= d2.WriteQty then d2.WriteQty - d1.WriteQty
 end as WriteQty,
 case
 when d1.ByteReadQty > d2.ByteReadQty then d2.ByteReadQty
 when d1.ByteReadQty <= d2.ByteReadQty then d2.ByteReadQty - d1.ByteReadQty
 end as ByteReadQty,
 case
 when d1.ByteWriteQty > d2.ByteWriteQty then d2.ByteWriteQty
 when d1.ByteWriteQty <= d2.ByteWriteQty then d2.ByteWriteQty - d1.ByteWriteQty
 end as ByteWriteQty,
 case
 when d1.IOStallMSQty > d2.IOStallMSQty then d2.IOStallMSQty
 when d1.IOStallMSQty <= d2.IOStallMSQty then d2.IOStallMSQty - d1.IOStallMSQty
 end as IOStallMSQty
 from DayDBStat d1, DayDBStat d2
 where d1.SrvName = d2.SrvName
 and d1.DBName = d2.DBName
 and d1.LogFileName = d2.LogFileName
 and d1.SampDate < d2.SampDate
 and DATEDIFF (day, d1.SampDate, d2.SampDate) = 1
 order by d1.SrvName, d1.DBName, d1.LogFileName, d1.SampDate
GO
-- Server stats
create view vDaySrvStat
as
select top 100 percent d2.SrvName,
 d2.SampDate,
 case
 when d1.ConnQty > d2.ConnQty then d2.ConnQty
 when d1.ConnQty <= d2.ConnQty then d2.ConnQty - d1.ConnQty
 end as ConnQty,
 case
 when d1.CPUBusyMSQty > d2.CPUBusyMSQty then d2.CPUBusyMSQty
 when d1.CPUBusyMSQty <= d2.CPUBusyMSQty then d2.CPUBusyMSQty - d1.CPUBusyMSQty
 end as CPUBusyMSQty,
 case
 when d1.IOBusyMSQty > d2.IOBusyMSQty then d2.IOBusyMSQty
 when d1.IOBusyMSQty <= d2.IOBusyMSQty then d2.IOBusyMSQty - d1.IOBusyMSQty
 end as IOBusyMSQty,
 case
 when d1.IdleMSQty > d2.IdleMSQty then d2.IdleMSQty
 when d1.IdleMSQty <= d2.IdleMSQty then d2.IdleMSQty - d1.IdleMSQty
 end as IdleMSQty,
 case
 when d1.PackRecvQty > d2.PackRecvQty then d2.PackRecvQty
 when d1.PackRecvQty <= d2.PackRecvQty then d2.PackRecvQty - d1.PackRecvQty
 end as PackRecvQty,
 case
 when d1.PackSentQty > d2.PackSentQty then d2.PackSentQty
 when d1.PackSentQty <= d2.PackSentQty then d2.PackSentQty - d1.PackSentQty
 end as PackSentQty,
 case
 when d1.PackErrQty > d2.PackErrQty then d2.PackErrQty
 when d1.PackErrQty <= d2.PackErrQty then d2.PackErrQty - d1.PackErrQty
 end as PackErrQty,
 case
 when d1.TotReadQty > d2.TotReadQty then d2.TotReadQty
 when d1.TotReadQty <= d2.TotReadQty then d2.TotReadQty - d1.TotReadQty
 end as TotReadQty,
 case
 when d1.TotWriteQty > d2.TotWriteQty then d2.TotWriteQty
 when d1.TotWriteQty <= d2.TotWriteQty then d2.TotWriteQty - d1.TotWriteQty
 end as TotWriteQty,
 case
 when d1.TotIOErrQty > d2.TotIOErrQty then d2.TotIOErrQty
 when d1.TotIOErrQty <= d2.TotIOErrQty then d2.TotIOErrQty - d1.TotIOErrQty
 end as TotIOErrQty
 from DaySrvStat d1, DaySrvStat d2
 where d1.SrvName = d2.SrvName
 and d1.SampDate < d2.SampDate
 and DATEDIFF (day, d1.SampDate, d2.SampDate) = 1
 order by d1.SrvName, d1.SampDate
GO
Results
Now, when you query these views, you get totals by server/database based on the time interval you choose. I'm reasonably certain these views are correct. If you find a bug, please let me know.
For our presentation layer, we created Excel spread sheets which link to these views and create bar graphs (managers love graphs) for trend analysis. We are currently working on upgrading this process (mostly for the learning experience) to SQL Server 2005, SSIS, SSAS, and SSRS for the presentation layer.
Conclusion
If you have any questions about the @@ counters or ::fn_virtualfilestats, they are well documented in Books Online. Obviously, there are a variety of ways to accomplish each step. We chose to keep daily statistics but you can keep more or less frequent intervals by simply changing the execution schedule on the DTS packages. This facility is relatively simple to set up. I admit, we're a small shop. But we've been running this process since Dec '04 and the database which hosts this data is only 180 MB. It has a small footprint and runs very quickly and reliably. I usually forget about it until management comes to us with capacity planning questions.


