At the recent TechEd North America 2011 conference, details on the next version of SQL Server called “Denali” were released. Part of those details were an update on the SQL Server Analysis Services (SSAS) roadmap. The main new feature in SSAS is a new data model, called the Business Intelligence Semantic Model (BISM). You can read the full details here, but the summary of it is as follows:
- It embraces the relational (also called tabular) data model and brings it together with the multidimensional model (OLAP) under a single unified BI platform, called the Business Intelligence Semantic Model
- The BI Semantic Model is one model for all end-user experiences – reporting, analytics, scorecards, dashboards, and custom applications. All client tools in the Microsoft BI stack – Excel, PowerPivot, SharePoint Insights and Reporting Services (including Crescent), operate on this model
- The model can be shared among all the tools, helping migration from one tool to another. For example, a PowerPivot workbook built by a business user can be used as a starting point by a BI professional building an Analysis Services application
- For existing Analysis Services cubes (also known as Unified Dimensional Model or UDM) – when you upgrade your Analysis Services project or server to SQL Server “Denali”, every cube automatically becomes a BI Semantic Model. The BI Semantic Model is an evolution of the UDM from a pure multidimensional model into a hybrid model that offers all of the capabilities of the UDM and more. As such, the term Unified Dimensional Model is no longer used with SQL Server “Denali” and is subsumed by the BI Semantic Model
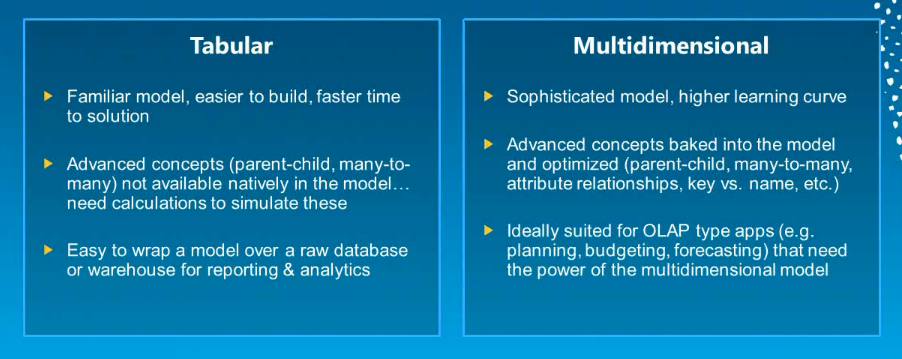
- BISM will allow SSAS to reach a much broader user base because the tabular data model is much easier to understand and build than the multidimensional model. Essentially, the tabular data model is equivalent to the data source view that is created when using the multidimensional model. But you don’t have to build a cube structure on top of it. So the ease of use with the tabular data model reduces the barrier to entry in using Analysis Services
The BI Semantic Model can be viewed conceptually as a three-layer model

- Data Model: The conceptual data model supporting both multidimensional and tabular data (an enhancement of the current PowerPivot data model experience will allow building of the tabular data model)

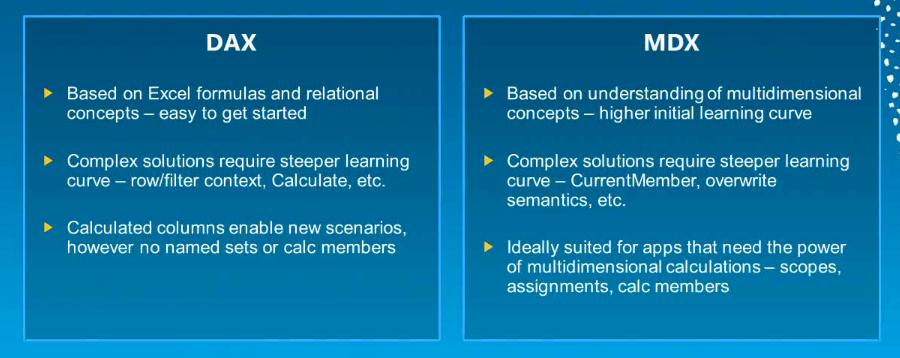
- Business Logic & Queries: Represents the intelligence or semantics in the model. The embedded business logic in the model uses MDX (Multidimensional Expressions) or DAX (Data Analysis Expressions) calculation languages

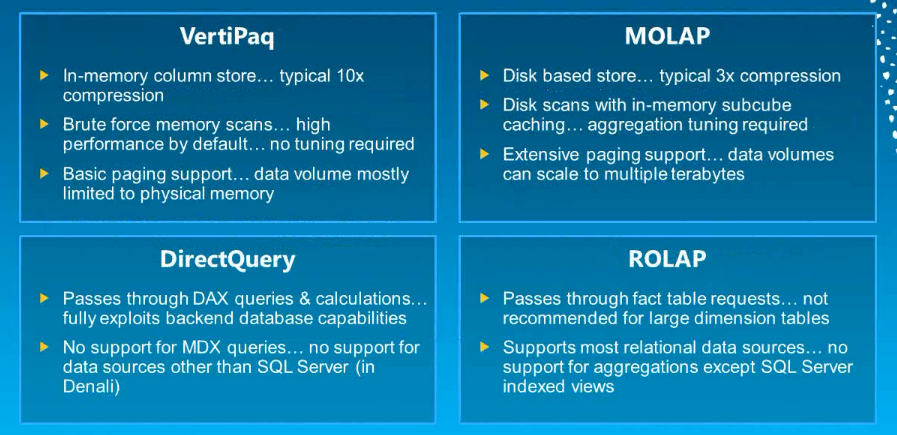
- Data Access: This layer integrates data from multiple sources – relational databases, business applications, flat files, OData feeds, etc. There are two modes for retrieving and managing this data – cached and passthrough. There are two storage engines that can be used for caching the data – MOLAP and VertiPaq. And there are two options for passthrough – ROLAP and DirectQuery

The BI Semantic Model can be built in Visual Studio and then stored in SharePoint, and you will be able to right-click any model and choose to launch it in Excel or create a Crescent report with it. The Excel user can consume the BI Semantic Model using the multi-dimensional data model, MDX, and VertiPaq, and the same BI Semantic Model can be consumed by Crescent using the tabular data model, DAX, and VertiPaq.
There are currently limitations on how the technologies mix: BI Development Studio comes with two projects for building a BI Semantic Model – a multidimensional project and tabular project. The multidimensional project lets model developers use the multidimensional modeling experience along with MDX and MOLAP/ROLAP (this is what existing UDM projects are upgraded to). The tabular project lets model developers use the tabular modeling experience along with DAX and VertiPaq/DirectQuery. But these limitations are not permanent and the SQL Server product team will work on removing them (for example, multidimensional models will likely support DAX queries, and thereby Crescent).
Which model do I use?
Multidimensional modeling (the concept of modelling data as cubes, dimensions and hierarchies) will be best for certain types of BI applications, such as financial applications with complex calculations and where you are doing budgeting, planning, and forecasting.
The tabular way of modelling data (the concept of modeling data as a series of tables and relationships) has many advantages of its own. I would estimate in a few years that maybe for 20% of the BI projects the tabular model would be best, 10% the multidimensional model would be best, and for the remaining 70% either will work fine (with most choosing the tabular model because it is easier). The best part is we will have a choice between two different but equally valuable ways of modelling data.
You may be concerned that the tabular data model would be slow, since a strong point of the multidimensional model is the ability to create measures for performance. But because the tabular data model uses VertiPaq, it is very fast since VertiPaq stores values in-memory so data retrieval and calculations happen at a much faster rate, as disk I/O processing is omitted.
These two worlds will grow together and we will see a convergence towards a componentized approach where every technology for every layer of the solution will be able to interact with the other components. In other words, the same client tool will be able to query any model, regardless of the technology used to implement it (either tabular or multidimensional). From the user perspective, this means that Excel will be able to query any tabular or multidimensional model, and the same will be true for the new Crescent tool. From the architectural perspective, any existing investment on any technology will be preserved. For the large number of scenarios where either models can be used, you don’t have to choose between a mature technology (UDM) that is not supported by modern tools (Crescent) and a new technology (VertiPaq) that misses some advanced features your user might expect in the solution because it was present in a solution that you used in the past.
Because of confusion from a previous Microsoft announcement about BISM, there was fear that you would have to redevelop existing multidimensional models to use the tabular model. That fear is now gone. The bottom line is the Business Intelligence Semantic Model replaces the Unified Dimensional Model, but supports existing multidimensional models and the new tabular model.
One other nice improvement with Denali: All the current “BIDS” components (SSIS, SSAS, SSRS) will be shipping on top of the Visual Studio 2010 shell (code name “Juneau”). With CTP1 of Denali, BIDS is still based on Visual Studio 2008, but in the next CTP (due this summer) it will use the 2010 shell. There will also be two SSAS projects: Analysis Services Multidimensional Project and Analysis Services Tabular Project, as well as an “Import from PowerPivot” option to create a new project based on a PowerPivot workbook.
The CTP1 of Denali was released on Nov 8, 2010, and you can download here. Also check my blog (SQL Server “Denali”). Bob Beauchemin has a great post that lists all the features included and not included in CTP1.
Here are some video sessions that will give you more info:
T.K. Anand & Ashvini Sharma’s recorded session from TechEd 2011: What’s New in Microsoft SQL Server Code-Named “Denali” for SQL Server Analysis Services and PowerPivot” (Explains BISM in-depth, creates a BISM model in Excel, talks about Crescent, shows how to use the new tabular model in BISM with Visual Studio, shows new features in PowerPivot, explains difference between tabular and multidimensional model)
Julie Strauss’ recorded session from TechEd 2011: Introducing the Next Generation Design Tools for Microsoft SQL Server Analysis Services (Shows how to use the new tabular model in BISM with Visual Studio)
Marco Russo’s recorded session from SQLBits 8: BISM Introduction


