Things Go South
Recently I was troubleshooting a piece of software that archives data out of a very active import table. It is a pretty simple app. It queries the table for any id’s that have data older than X days. It then queries the table again to pull the detail data generating a csv file, table schema script and compresses them for storage. Well, it was running slow. Much slower than expected in fact. It has to process around 5000 id’s and it was taking 50 to 240 seconds an id. This doesn’t sound slow but it adds up in a hurry. I started digging into the code looking at the normal culprits. Network slow? No. Disk IO a problem? No. It must be the compression engine! It takes the CPU to 100% and leaves it there. That metric by itself isn’t a bad thing but I just wasn’t seeing what the problem was. I plugged in other compression engines and tweaked the settings. Oddly enough, every engine performed about the same! I knew there was something I was missing. Stripped things away until I was left with one thing, the query that pulls the detail data from SQL Server.
The Big Boy(TM)
The table in question is big, due to the archive tool slowing down it has ballooned up to 240GB, in a single table, that shouldn’t be more than 10GB or 20GB at any one time. It gets most of the heft not in just rows but the width of the table. I took my sample slow query and started running permutations on it. In the grand scheme of things it wasn’t returning a large row count, around 183,000 or so. The data size was pretty large at 650MB. Still, not anything that would choke the network or our system by any means.
Turn The Knobs
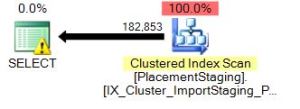
I though it may be that the application was choking on the data size. So, I stepped out of the app and ran the query in SSMS. It ran in the same time that the program did as far as query execution. I put a TOP clause on it cutting the number of rows in half thinking I would get the data back in half the time. I was way off! Instead of the 40 seconds it was now taking around 5 seconds. I pulled the TOP clause off again and watched the data come back. I noticed it returned data pretty quickly. As a matter of fact, it returned almost all the rows in just a few seconds. It would then spend the next say 30 seconds waiting for the last few rows. At this point I thought something was wrong with my workstation. I ask a co-worker to run the same two queries, one with the TOP and one without. He got the exact same results I did! I started to panic a little bit. What if something was wrong with the server or there was corruption in the database? I decided to play with the TOP clause getting the count to within a couple of records before things would slow down dramatically. I looked at the crazy simple plan nothing to see here but a scan and return.
Digging Deep, Pinging my Tweeps
If you aren’t on twitter you are missing out on a valuable resource. There are members of the SQL Server community that hang out watching #sqlhelp that might just be qualified to offer you an opinion on your problem. MVP’s, MCM’s and beyond! Sometimes they are just really smart people like Paul White (blog | twitter). He may not have any of the magic three letters in his title he is still extremely capable. If you aren’t reading his blog you need to start now. Anyway, I tweeted my dilemma and several people responded. I had already tried everything that people were suggesting Paul offered to take a look at the execution plans and see if he could figure it out. I was pretty sure it had something to do with the data layout on disk and the fact I only had a single index, the clustered key, on the table which I wasn’t searching on. What I expected to get was a full scan every time on the table. When I added the TOP clause SQL Server was smart enough to say “Stop scanning when X records are returned” So, when I returned all 182,853 records it had no choice to to scan the entire table.
I think Paul explains it pretty well:
It seems that the first 182,852 matches on (IDFK = 69468) appear relatively early in the clustered index (scanning in clustered key order).
The 182,853rd record appears to be much later in the clustered index – perhaps quite close to the end of the table, so SQL Server scans a large number of pages after finding the 182,852nd match before it encounters the next one. If you select the clustered index key plus IDFK from the table, and number the rows using ROW_NUMBER(OVER ORDER BY (SELECT 0)) you should find a big gap in clustered key values between records 182,852 and 182.853.
Note – Which I did find – Wes
When you request the TOP (182852) records, the scan stops as soon as that many records are found – so the scan does not continue across the big gap in clustered index key values to find the 182,853rd value.
Note – I also played with SET ROWCOUNT and had the exact same results. – Wes
Side note. The query does not request the results in clustered key order, but the storage engine has no other choice as the query is written. If you add WITH (TABLOCK), WITH (NOLOCK), or otherwise modify the table so that no data changes are possible while the scan is running (perhaps by making the database read-only, or placing the table on a read-only file group) – the storage engine will be able to scan from the IAM pages, which will result in rows coming back in the order pages were allocated to the table. Depending on the distribution of records with (IDFK = 69468), you might get better, or worse, performance – but the big gap between record #182,852 and #182,853 will almost certainly disappear. Of course, the storage pattern might result in other such gaps!
Thanks Paul!
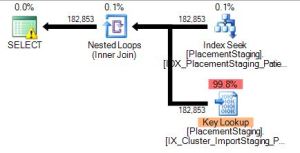
I did test the NOLOCK and TABLOCK, both had similar results that sped up the query. Alas, I couldn’t do ether since there is data changes taking place during the archive process. I opted for a covering index on the search key, which automatically includes the primary key and a bookmark lookup. Now it is faster and consistent on speed.
And that is how the mystery of the slow last row was solved!


