One of the national sponsors for SQL Satuday is Confio Software. Just because they sponsor SQL Saturday, it’s worth checking out their product, but they also host the speaker’s dinner at these events. So, having eaten off their dime, I felt obligated to take a look. I’m glad I did.
Confio Ignite is a monitoring software that keeps real-time and historical track of the performance of your SQL Server (and Oracle and DB2) database servers. It’s focus is on wait states and queues, a very common method for troubleshooting performance.
You can get a trial download from their web site to run for a couple of weeks yourself. Everyone’s first impression of a software, after the web site of course, is when go to do the install. The install routine for Ignite was very easy. It’s also a bit of a shock. It actually uses web pages for configuration. This makes sense when you consider that the software originally comes from Oracle and Unix systems. Anyway, despite the bit of weirdness of using a web page for configuring software, it’s a very easy install. Once the install is complete, it’s also really simple to add servers for the software to monitor.
I put it to work on a number of development servers to start (I’m not plugging some unknown software into Production without a shake-down. I may be stupid, but I’m not crazy). It’s agentless and it began running queries against the systems immediately. It’s storing the data to my local desktop. That data is available in real-time, a historical view, or a trending view, showing how performance is changing over time. It’s all through a web site, not dissimilar to Quest’s Foglight. You can see a list of servers, their immediate state, action choices and some other general info.
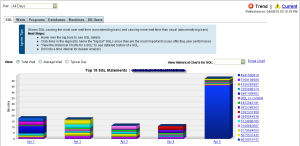
Clicking a server, after it’s had time to gather data, put’s you into the Trend screen. It’s laid out very nicely. You get to break down performance by SQL, Waits, Programs, Databases, Machines, or Users. Then it shows information by Total Wait, Average Wait or Typical Day. The chart gives you a visual representation of queries running against the system, by default numbered and assigned by an internal hashing system that Ignite uses (no, I don’t know what the internals look like, I’m inferring that from the information presented). Down at the bottom of the screen you can see Top Query Problems, which shows you queries that are running slow or using too many resources according configurable settings, or Resources, your standard breakdown of CPU, Memory Paging, Disk Queue and the rest, or SQL Text, literally the queries that have been running on your system.
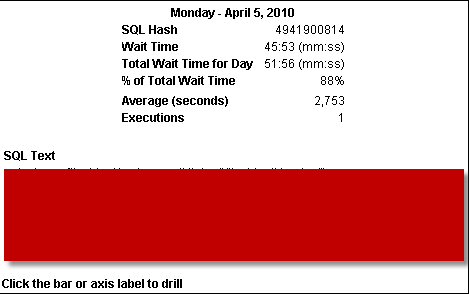
Almost everything has a drill down that takes you to a lot more information, and there are pop-ups that show you bits of detail.
I’ve only been running it for a few days, but I can already see how it could be very useful. I’m very happy with the focus on waits and on queries. So often when you’re looking at these tools queries are either an after thought or ignored completely. You frequently have to spend time monitoring your queries on your own, while that very expensive monitoring software is tracking page life expectancy and buffer cache hit ratio, both useful measures, but you still need to know which query is causing the problems. Ignite will get to that information right away and still collect the other as well.
So far, I’m pretty pleased with the software. I’m going to switch this over to a production system in the next few days and see what I can see with Ignite running against a real system. More to come.


