In case you haven’t discovered this for yourself, SQL Server Profiler is one of the most powerful tools that come with SQL Server. It has the ability to gather huge amounts of data you can use to help you identify and troubleshoot many different SQL Server problems. In fact, Profiler can capture about 180 different events, and for each event, it can collect many different data columns (up to 64).
When I was a novice DBA and needed to run a new trace, I would go to New Trace within Profiler and create a new trace that I customized to collect the data I needed to identify and troubleshoot a particular problem. Once I had gathered the data I needed and fixed the problem, I would exit Profiler without saving the trace definition or the data I had collected. I didn’t see any need to save it once the immediate problem was resolved.
After creating many traces over time, I noticed a pattern. More often than not, I would recreate the same trace over and over again, each time from scratch. Another thing I noticed was that when I created a trace definition from scratch, I couldn’t always remember exactly how I had created the trace definition in the past, and I ended up wasting time experimenting with various events and data columns until I got what I needed. I was wasting a lot of time creating the same trace definitions over and over again.
Then I discovered Profiler templates. A Profiler template is a reusable Profiler trace definition that you can use again and again. Profiler templates were not new to Profiler, but as a novice DBA, I had never taken the time to learn how to use them properly.
Some of the many benefits to using Profiler templates are that:
- You save time because you don’t have to re-create trace definitions every time you need them. This is especially helpful if your trace definition is complex and includes many different events and data columns, which can be time-consuming to set up.
- Once a template has been created, you don’t have to remember which events, data columns, or other settings you need. This way, once you have perfected a trace definition, you don’t have to remember how to recreate it every time you need it.
- You can share Profiler templates with others, and vice versa.
- You can export a template’s trace definition so that you can use it with SQL Trace. This can save a lot of hand coding of the stored procedures needed to create a trace using SQL Trace.
- In SQL Server 2008, you can export a trace definition to create your own SQL Trace Collection Set for the Performance Data Collector, which allows you to collect and store historical trace data in a Management Data Warehouse database.
If you have used Profiler, you know that it comes with some sample Profiler templates. While I think they are handy for novice DBAs who are learning how to use Profiler, I have never found that they exactly meet my needs. Because of this, I create all of my own trace templates. Since the focus of this chapter is on creating your own trace templates, we won’t discuss the sample templates here. Instead, we will show you how you can save a great deal of time by creating your own custom Profiler templates you can use in your day-to-day work.
Creating a Profiler Template
There are essentially three different ways to create a Profiler template:
- Use the New Template option from within Profiler
- Create a template based on a pre-existing trace definition
- Create a template based on a pre-existing trace file.
While the New Template option might seem the easiest way to create a template, I have found in actual practice that creating a template from a pre-existing trace definition or trace file is more the norm, as least for me. All these options work fine. Just pick the one that best fits your needs.
Creating a Profiler Template Using the New Template Option
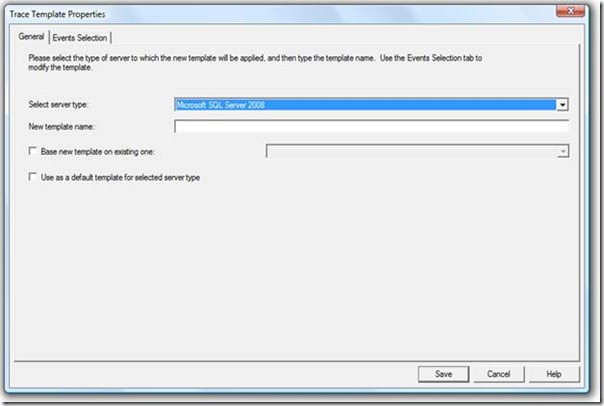
To create a Profiler template using the New Template option, start Profiler, then select File|Templates|New Template, and the General tab of the Trace Template Properties screen will appear.
Figure 1: The General tab of the Trace Template Properties tab is where you begin creating a trace template.
The first step is to select the type of server you want to trace. When you click on the Select server type drop-down box, you have five choices in SQL Server 2008. Not only can you trace data from SQL Server 2008, you can also trace data from SQL Server 2005 and SQL Server 2000. As you might expect, the reason you are given these choices is because each of these different versions offer a different set of events that can be traced. So when you select a server type, what you are telling Profiler is that you only want to select events that are available for the version of SQL Server you want to trace.
Figure 2: To create a Profiler template, you must select which server type you will be tracing.
Next, assign the template a name. While you can choose any name you want, I suggest you make it as descriptive as you can so that you can easily remember what the trace does.
When creating a new template, it will usually be created from scratch. But in some cases, you may want to copy a pre-existing Profiler template, and then modify it. This can come in handy if you already have a template that is close to what you need, so you only need to make a few changes, and then save the new Profiler template. In this case, select the checkbox next to Base new template on existing one, then select a pre-existing template from the drop-down box. Later, when you go to the Events Selection tab, you will see the settings from the pre-existing template, which can be easily changed.
The last option, Use as a default template for selected server type, doesn’t offer much value. If you select this option, then the Profiler template you are creating now will become the default template that is displayed when you create a new trace using the New Trace option. In most cases, you will use the drop-down box to select the trace template you want, so the default trace is irrelevant.
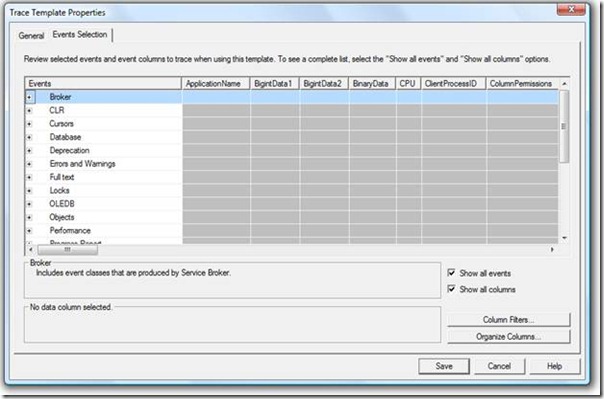
Now that we have completed the General tab of the Trace Template Properties screen, it’s now time to go to the Events Selection tab.
Figure 3: The Events Selection tab of the Trace Template Properties screen is where you create your trace definition.
Next, you create a trace definition, selecting the optimal combination of events, data columns, column filters and column organization that best meet the needs of your specific trace. Once you have made your selections, click on Save and the template is saved.
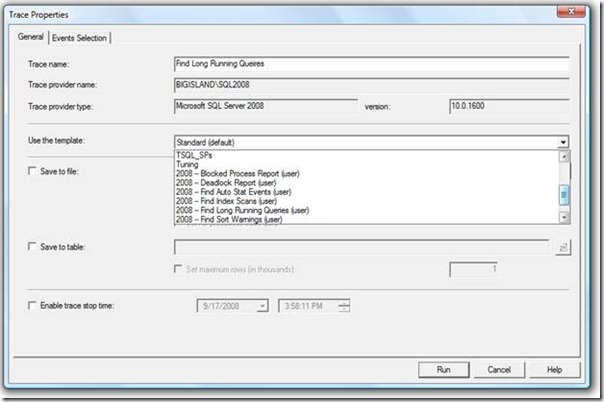
Figure 4: The word (user) appears after every Profiler template you create.
Now, when you use New Trace in Profiler to begin a new trace, the Profiler Templates you have created will be available in the drop-down box next to Use the template. See figure 4. Notice that all the Profiler templates you create will have (user) after their name. This is to differentiate them from the default templates that come with Profiler.
Creating a Profiler Template Using a Pre-Existing Trace Definition
As I mentioned earlier, I generally don’t use the New Template option to create templates. Instead, I prefer to go to New Trace in Profiler and create a new trace definition, just as if I were creating a temporary trace definition that I would discard after using it once. The reason I do this is because it allows me to experiment with various combinations of events, data columns, column filters, and column organizations; until I find the one single combination that works best for me. I experiment with my trace definition on a test or production server (carefully, of course, to prevent any unnecessary performance hit), which gives me real-time feedback on the kind of results the trace is producing. Using the New Template option does not give me the ability to test and experiment with my settings, so using the New Template option is best only if you know exactly what you want before you start.
Once I am satisfied with my trace definition, then I save the trace definition as a Profiler Template. Saving an existing trace definition as a Profiler template is fairly straight-forward, but there are a few quirks you need to be aware of.
If you have been experimenting with the trace, starting and stopping the trace, changing various settings, and starting and stopping the trace again, you must keep in mind that no trace can be running when you want to save the current trace definition as a Profiler template. So if your trace happens to be running when you are ready to save it as a Profiler template, you must stop the trace first.
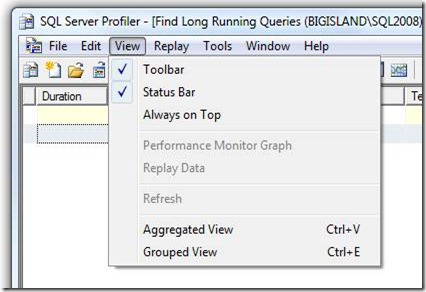
At this point, you will probably have some captured Profiler events displayed on the screen. This is normal. But before you can save the trace definition as a Profiler template, you must first ensure that if you have used the Organize Columns option as part of your trace definition to group events, you must first turn this feature off. If you don’t, then you won’t be able to save the trace definition as a Profiler template, as the Save as|Trace Template option will be grayed out. So before you save the trace definition as a trace template, from within Profiler choose View and make sure that the Aggregated View option is deselected. Making this change won’t affect the grouping of future trace captures, as this change only affects how the results of the currently displayed trace results appear on the Profiler screen.
Figure 5: Before you can save a pre-existing trace definition as a Profiler template, you must ensure that Aggregated View is deselected.
Now you are ready to save the current trace definition as a Profiler template. To do this, select File|Save As|Trace Template from Profiler and the following screen appears.
Figure 6: Assign your Profiler template a name that accurately describes the template.
The Server type is filled in for you because Profiler already knows what server you have attached to. All you have to do is to give the Profiler template a descriptive name and click OK and the Profiler template is saved, ready for you to use.
Creating a Profiler template Using an Existing Trace File
In some cases, you may have created a trace definition and saved a trace file, but neglected to save the trace definition as a Profiler template before you exited Profiler. No problem. If you still want to turn the trace definition into a Profiler template, you can. All you have to do is to load the saved trace file into Profiler so that the results are displayed on the Profiler screen. Next, check to see that the Aggregated View option is not selected, then select File|Save As|Trace Template to save the Profiler template.
Modifying an Existing Profiler Template
On some occasions, you may want to change an existing Profiler template. To do so, start Profiler, and then select File|Templates|Edit Template. This displays the Trace Template Properties screen (see figure 1), which is the same screen that is used to create a new Profiler template. The only difference is that instead of entering a new name for the Profiler Template, you select an existing template from a drop-down box. Once you have selected the template to edit, make your changes, just as you did when creating the template in the first place, and click Save.
Exporting and Importing Profiler Templates
Lots of DBAs share their Transact-SQL scripts, but you rarely see DBAs share their Profiler templates. This is a shame, as sharing Profiler Templates is very easy to do, and like the sharing of Transact-SQL scripts, DBAs can save themselves a lot of time by not having to reinventing the wheel. In addition, the exporting and importing of Profiler templates makes it easy for you to move them from one computer to another.
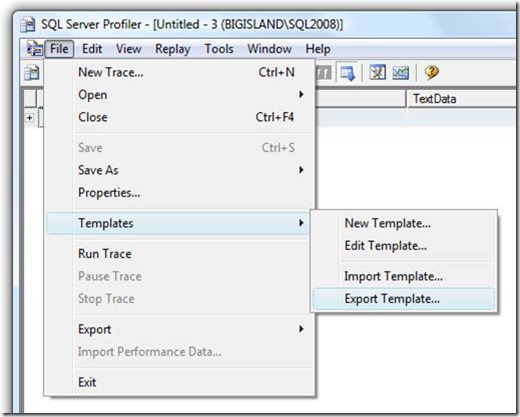
Figure 7: You can export your Profiler Templates so that others can import them into their own copy of Profiler.
To export a Profiler template, start Profiler, and then select File|Templates|Export Template. At this point, the “Select Template Name” dialog box appears, where you select the template you want to export. Once it is selected, click on OK and a dialog box appears, allowing you to select where you want to export the Profiler Template to, along with the name you want to give it. Once you are done, click Save and the Profiler template is saved and can now be imported into another copy of Profiler.
To import a Profiler template, start Profiler, and then select File|Templates|Import Template. An Open File dialog box appears. Point to the Profiler template file you want to import, and select Open, and the Trace template is imported into this copy of Profiler.
While the Profiler import and export options are convenient ways to move Profiler templates from computer to computer, it is not your only option. If you like, you can just copy the physical Profiler template files themselves. Profiler Template files have an extension of .tdf, and for SQL Server 2008, are located in this folder: Drive_Letter:\Users\User_Name\AppData\Roaming\Microsoft\SQL Profiler\10.0\Templates\Microsoft SQL Server\100.
Scripting a Profiler Template for Use with SQL trace
While SQL Trace offers many performance benefits over using Profiler, many DBAs don’t use SQL Trace because they think they will have to write a lot of Transact-SQL code to implement it. Fortunately, this is not the case. Here’s the trick. Instead of hand-writing Transact-SQL code to create and implement SQL Trace definitions, use Profiler to write the code for you. How? First load an existing Profiler template, or create a new Profiler Template, then export the trace definition for the template to a Transact-SQL file, which you can then use to create a SQL Trace definition.
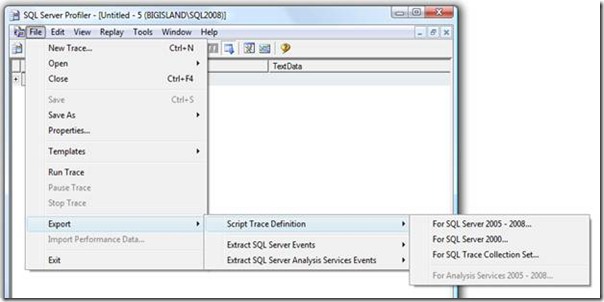
Figure 8: You can export Transact-SQL versions of your Profiler template to use with SQL Trace.
To do this, start Profiler, then either load an existing Profiler template, or create a new one. To export the Profiler template as a Transact-SQL file, select File|Export|Script Trace Definition|For SQL Server 2005-2008. A Save As dialog box appears, allowing you to name the file and to save it in any folder you prefer.
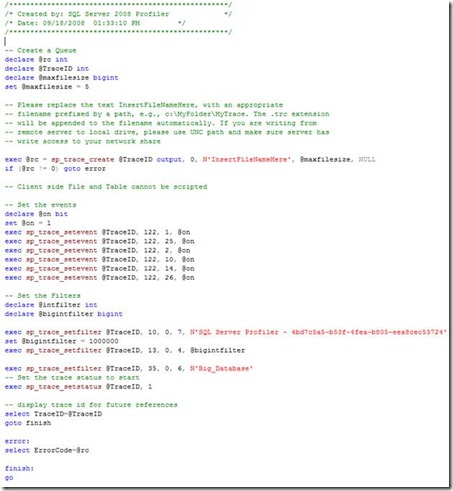
Below is a short example of the output produced by this option. Keep in mind that this example is a short one. Most of these scripts are much longer than this sample.
Figure 9: An example of a Transact-SQL file that can be used to create trace definitions using SQL Trace.
This code can be run as it is, or modified as needed, to create a trace definition for use with SQL Trace. It is much faster to create your SQL Trace definitions this way, than by typing them by hand.
Using Traces with the Performance Data Collector
In SQL Server 2008, a new feature called the Performance Data Collector was added. It has the ability to collect SQL Server-related performance data, store it in a database called the Management Data Warehouse, and then produce various performance reports based on the collected data.
By default, the Performance Data Collector includes three different data collection sets (Disk Usage, Query Statistics, and Server Activities) that are used to collect a wide variety of SQL Server 2008 performance data. One of the features of the Performance Data Collector is that you can create your own data collection sets, which allow you to decide what kind of data you want to collect and store in the Performance Data Collector’s Management Data Warehouse. For example, if you want, you can create your own custom data collection set to collect and store Profiler trace data. Once the data has been collected and stored in the Management Data Warehouse, you can then create queries or Reporting Services reports to analyze the data you have collected.
There are two ways to create your own custom data collection set to collect and store Profiler trace data. You can either write a custom Transact-SQL script from scratch, or you can let Profiler write the script for you. Let’s see how Profiler can do this for us.
First, ensure that the Data Collector has been properly configured and is running properly. Next, start Profiler and load an existing Profiler template, or create a new Profiler Template. Keep in mind that the SQL Trace Data Collection Set will be based on your Profiler template, so choose an appropriate one.
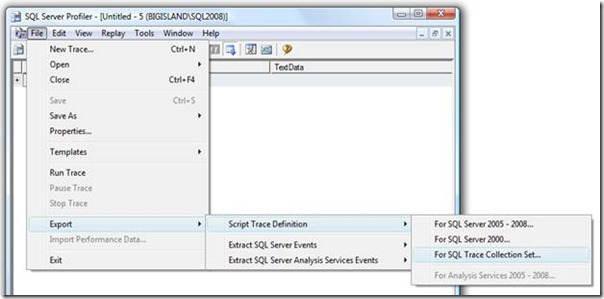
Figure 10: Export a Profiler Trace to a Performance Data Collector SQL Trace Collection Set.
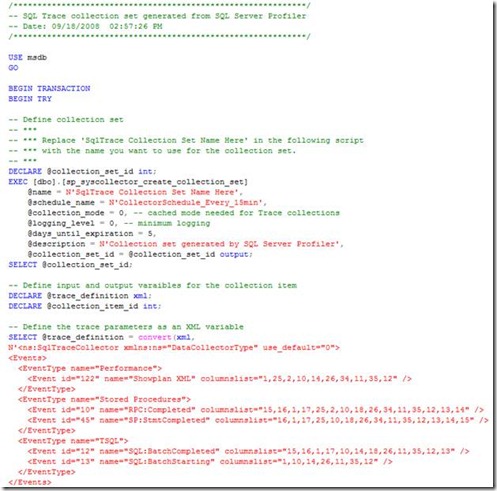
Our next step, as shown in Figure 10 is to convert the Profiler template into a Transact-SQL file that can be executed later to create the SQL Trace Collection Set. To do this, select File|Export|Script Trace Definition|For SQL Trace Collection Set, and a Save As dialog box appears, allowing you to name the file and to save it in any folder you prefer. Once the script has been saved, it can be opened in SSMS. For example, the Transact-SQL script that is created looks similar to this (it has been truncated because of its length).
Figure 11: Profiler can create a SQL Trace Collection Set for you automatically.
Before you can run this script and create the SQL Trace Collection Set for the Performance Data Collector, you need to make two changes in the code. If you look through the generated code, you will see these place holders:
‘SqlTrace Collection Set Name Here’
‘SqlTrace Collection Item Name Here’
You will need to replace these place holders with descriptive names. Once the code is changed and executed, you will see the new SQL Trace Collection Set in SSMS, along with the three default collection sets that come with SQL Server 2008. At this point, you can enable the new custom collection set, and it will begin collecting Profiler trace data based on the criteria you specified in the Profiler template you used as the basis for creating it. If you like, you can create as many different SQL Trace Collection Sets as you want, with each one based on a different Profiler template.
One warning about creating your own custom SQL Trace Collection Sets—they can use a lot of SQL Server resources and disk space when enabled. To minimize this impact, ensure that the Profiler templates that you use to create your SQL Trace Collection Sets only collect the minimum number of events and data columns you need. In addition, only enable SQL Trace Collection Sets as needed; don’t run them all the time.
Summary
In this chapter, we have taken a look at many different ways Profiler traces can be created and used. Whether you are creating templates for use with Profiler, for use with SQL Trace, or for use with the Performance Data Collector, taking advantage of Profiler traces can make you a much more productive DBA.
You can learn more about how to use Profiler by downloading my free e-book: Mastering SQL Server Profiler.


