When working with SQL Server you can almost guarantee yourself of one thing – there will come a time when performance (specifically that of a query) is less than stellar. When that happens, then it is time to start digging into the environment on a fact finding expedition.
Every once in a while, the facts may be difficult to find and thus the cause of the performance issue may not be very evident. It is during a moment such as this that one needs to dig deeper and possibly even reach out for help. Asking for help is a good thing. When one is able to break down and ask for help, they are submitting themselves (generally speaking) to an opportunity to learn more.
For an outsider to see what the problematic code is doing, the execution plan needs to be exported and posted someplace so it can be dissected by those who will be providing their services. Exporting an execution plan is a short and simple exercise that I will explain.
When looking to export the actual execution plan for a poorly performing query, there are generally two methods to do it. I will cover each method. There are benefits to each method, and it will be left to you to determine which method you will employ.
Plan Cache
The first method is to find the execution plan in the plan cache. The benefit of this method is that the query will not need to be rerun to trap the plan. If you are on a busy production system, this could be beneficial in that it will not impose an extra load. If the query decided to suddenly start taking hours to complete, then you will also be able to save a big chunk of time by retrieving the plan direct from cache instead of running the query.
To retrieve the execution plan, one could run a query such as this:
SELECT TOP 10total_elapsed_time/1000.0 as total_elapsed_time,execution_count,(total_elapsed_time/execution_count)/1000.0 AS [avg_elapsed_time_ms],last_elapsed_time/1000.0 as last_elapsed_time,total_logical_reads/execution_count AS [avg_logical_reads],st.Query,qp.query_plan,qs.plan_handleFROM sys.dm_exec_query_stats AS qsCROSS APPLY sys.dm_exec_query_plan(qs.plan_handle) as qpCROSS APPLY sys.dm_exec_sql_text(qs.sql_handle) st1CROSS APPLY (SELECTREPLACE(REPLACE(REPLACE(REPLACE(REPLACE(REPLACE(REPLACE(REPLACE(REPLACE(REPLACE(REPLACE(REPLACE(REPLACE(REPLACE(REPLACE(REPLACE(REPLACE(REPLACE(REPLACE(REPLACE(REPLACE(REPLACE(REPLACE(REPLACE(REPLACE(REPLACE(REPLACE(REPLACE(REPLACE(CONVERT(NVARCHAR(MAX),N'--' + NCHAR(13) + NCHAR(10) + ist.text + NCHAR(13) + NCHAR(10) + N'--' COLLATE Latin1_General_Bin2),NCHAR(31),N'?'),NCHAR(30),N'?'),NCHAR(29),N'?'),NCHAR(28),N'?'),NCHAR(27),N'?'),NCHAR(26),N'?'),NCHAR(25),N'?'),NCHAR(24),N'?'),NCHAR(23),N'?'),NCHAR(22),N'?'),NCHAR(21),N'?'),NCHAR(20),N'?'),NCHAR(19),N'?'),NCHAR(18),N'?'),NCHAR(17),N'?'),NCHAR(16),N'?'),NCHAR(15),N'?'),NCHAR(14),N'?'),NCHAR(12),N'?'),NCHAR(11),N'?'),NCHAR(8),N'?'),NCHAR(7),N'?'),NCHAR(6),N'?'),NCHAR(5),N'?'),NCHAR(4),N'?'),NCHAR(3),N'?'),NCHAR(2),N'?'),NCHAR(1),N'?'),NCHAR(0),N'') AS [processing-instruction(query)]FROM sys.dm_exec_sql_text(qs.sql_handle) AS istFOR XMLPATH(''),TYPE) AS st(Query)WHERE st1.text like '%sys.sql_modules%'ORDER BY last_elapsed_time DESC;
Once I have executed the preceding query, I can browse the results and then select the execution plan for the matching query. Here is a sample result set on my system for that query.

Notice that two columns in the result set appear like hyperlinks. The values in these columns are clickable. When clicked, the value will open a new query tab in management studio with either the Query (formatted for readability) or the graphical execution plan – depending on which column value is clicked. I use the Query link to help determine the correct query, and then select the query_plan that is associated to that query.
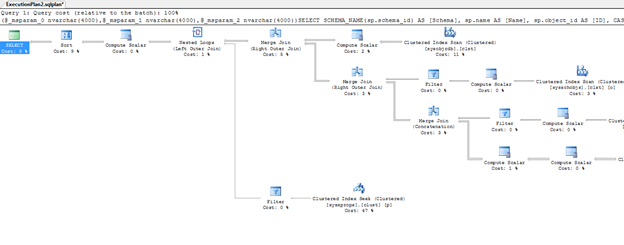
From here, the export becomes a little easier. It just so happens that the query I want this time is the first result in the result set. Knowing the first record contains the query_plan that I want, I simply click on the associated value for the query_plan and the first record. The new tab should open and present a graphical execution plan (much like shown in the following image).

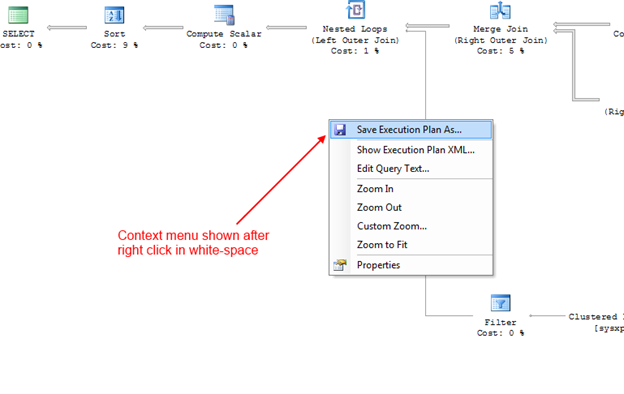
Notice that in this case, the new tab is labeled as ExecutionPlan2.sqlplan. It just so happens that the file extension for an exported execution plan is sqlplan. This indicates that we are pretty much ready to export the execution plan. Now one just need right-click somewhere in the whitespace of the graphical execution plan (anywhere in the plan that does not contain an image or text of some sort), to get the context menu displayed in the following.

Clicking on “Save Execution Plan As…” will introduce a new “Save As” window. Give the execution plan a name and then click save. Make sure to take note of the location to which the plan was saved so it can be retrieved at a later point. That is it! Saving the plan, as can be seen, is really easy.
Executing Query
The second method I mentioned involves running the query to produce an execution plan. This is not displayed automatically and requires that it be turned on in order to retrieve the plan from this method. Enabling the actual execution plan is very easy.
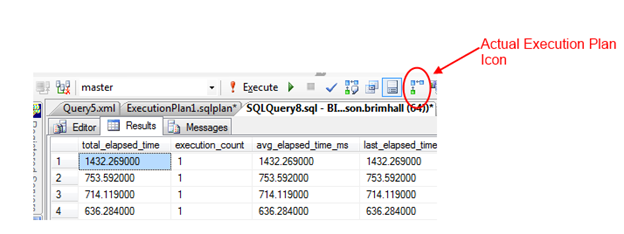
From within management studio, there is an icon on the toolbar to enable the display of the actual execution plan. That icon looks like the following.

Once that icon is clicked (enabled), then when the query is executed from that session (enabling Actual Execution Plan is per session), an execution plan will be displayed as well as the query results. Once the execution plan is displayed, the process to export is just the same as was discussed in the “Plan Cache” section of this article.


