A good way to crash your busy OLTP server is to start a trace running through the SQL Server Profiler that includes high-frequency events without a limiting filter. A database server with an active OLTP workload can generate a large number of trace events as hundreds or thousands of queries per second execute. SQL Server might not crash in the literal sense, but a client-side trace can cause the server to become sluggish or unresponsive to the point of causing query timeouts and other application problems while the trace is running.
This article will show how to use Profiler to create a server-side trace that runs unattended and incurs less tracing overhead than a client-side trace that is run directly from the SQL Server Profiler. I’ll assume you are already familiar with tracing concepts, Profiler and server-side tracing scripts. I covered server-side tracing concepts and scripts in the previous articles of this Stairway.
I don’t want to sound alarmist about using SQL Server Profiler for tracing. Profiler is an excellent tool that I use often and extensively. But I think it is important to understand what happens with client-side versus server-side tracing so that you can choose the right tool for the task at hand. The main performance consideration with client-side traces is that a graphical client application like Profiler might not be able to consume trace data as fast as it is generated. This typically happens only when a large amount of trace data is collected (i.e. hundreds or thousands of records per second), which may occur when high-frequent events are generated on a server with a high OLTP workload. Client tracing slowness can negatively affect overall database server responsiveness when too many tasks wait on resources inside the database engine. In short, inappropriate use of a Profiler trace can cause major performance problems and even cause SQL Server to become completely unresponsive.
One can mitigate some of the impact of Profiler traces by running the tool remotely rather than locally on the database server. The advantage of running a Profiler client-side trace remotely is that it won’t compete for CPU and memory resources with the database server. But the downside is that streaming data over the network is often slower than local processing and that latency can introduce a tracing bottleneck with large traces. Also, a remote trace on the same network interface used by client applications will reduce the network bandwidth available to clients.
In contrast with SQL Server Profiler client-side traces, server side traces run unattended inside the database engine and write collected event data directly to files in large blocks with no application involvement. Server-side traces therefore use fewer resources than Profiler and SMO client-side traces and also avoid the overhead of displaying data during collection and other processing. Server-side traces in SQL Server are optimized to collect data as fast as possible, thus allowing large amounts of data to be collected without significant impact to overall database server performance.
Server-Side Trace Scripting with Profiler
I mentioned in Level 2 of this StairWay that it is a tedious task to create a trace definition script from scratch. SQL Server Profiler is a great tool to make this chore an easy one. To create a server-side trace script with Profiler, first run a Profiler client-side trace with the desired events, columns and filters. Then export the trace definition from Profiler as a T-SQL script and customize the script for the target server.
Below is a walkthrough of these steps to create a server side trace of attention events. An attention event occurs whenever a query is cancelled by a client application, which includes SQL commands that are automatically cancelled by client data access APIs due to timeouts. An attention event trace complements a trace capturing long-running queries (discussed in Level 2 of this Stairway) because you can identify not only queries that ran excessively long, but also those that resulted in application query timeout errors or that were cancelled by impatient users. One can also determine how long it took to cancel the query by including the attention event duration column in the trace.
Note that if you were to simply add attention events to the long-running query trace, attention events shorter than the duration filter of the long-running query trace won’t be included in the trace and there will be no evidence that the query was cancelled. It is necessary to run separate traces since we have different duration thresholds for different events. We want all attention events to be captured, without a duration filter, while details of long-running SQL:BatchCompleted and RPC:Completed events should captured separately by a trace that includes a duration filter.
Create and run a new trace
Launch SQL Server Profiler. From the menu, select FileàNew Trace and connect to a SQL Server. The instance you choose for this connection does not necessarily need to be the same one you intend to run the server side trace on; Profiler just needs a database connection to create the trace definition. I typically use a test server for this purpose. It is best to specify a server that is the same SQL Server version as the one you plan for the server-side trace because the Profiler event selection list includes only events available to the SQL Server you are connected to.
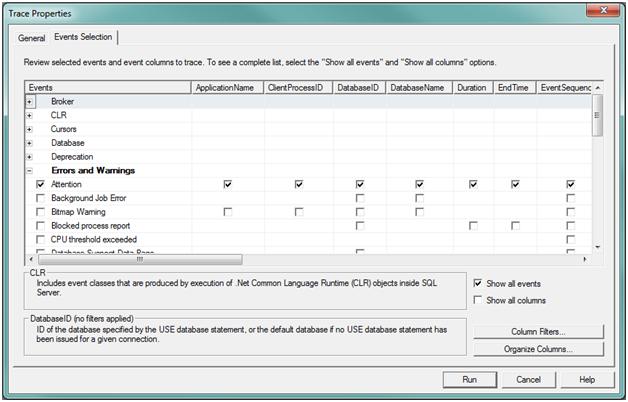
On the Trace Properties window, select “Blank” from the template drop-down box and click the Events Selection tab. Expand the Errors and Warnings category. Check the box to the left of the attention event to include that event and all visible columns associated with the event. Figure 1 shows the Profiler Event Selection window after the attention event is selected.

Figure 1: Attention event selection in Profiler
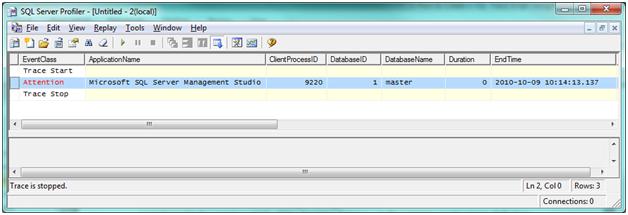
Profiler requires that you run the trace as a client-side trace before the trace definition may be scripted for server-side tracing. Click the Run button to execute the client-side trace. You can verify the trace collects attention events as expected by running a WAITFOR DELAYquery from SSMS (e.g. WAITFOR DELAY '00:01:00') and then stop the query while it is running. Cancelling the running query will generate an attention event. Stop the trace (FileàStop Trace). As shown in Figure 2, the Profiler trace output screen will show the attention event from the cancelled query as well as Trace Start and Trace Stop events.

Figure 2: Profiler trace screen after running the trace.
Export the trace definition and customize the script
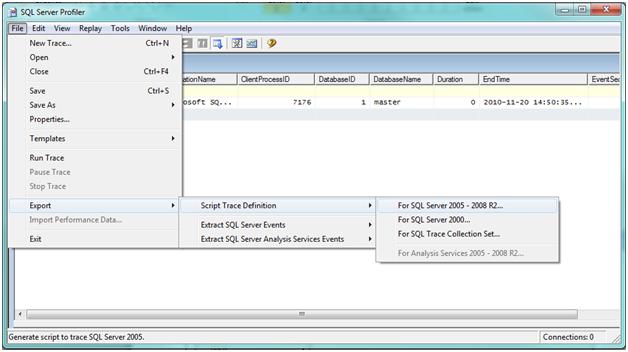
Now that the trace has been run, Profiler can create the server-side trace T-SQL script. Click File | Export | Script Trace Definition | For SQL Server 2005 – 2008 R2, as shown in Figure 3. Save the script as AttentionEvents.sql and close Profiler. If the trace definition were to include events that are not available in the targeted SQL version, Profiler would display an informational message and exclude those from the generated script.

Figure 3: Profiler Export menu
Open the saved AttentionEvents.sql script file in SSMS and connect to the SQL Server instance you want to run the server-side trace on. As Listing 1 shows, the script includes all of the SQL commands needed to define and run this server-side trace. However, the trace file path and trace properties must first be customized.
 /****************************************************/ /* Created by: SQL Server 2008 R2 Profiler          */ /* Date: 10/09/2010  10:26:08 AM         */ /****************************************************/ -- Create a Queue
 declare @rc int
 declare @TraceID int
 declare@maxfilesize bigint
 set@maxfilesize = 5
 -- Please replace the text InsertFileNameHere, with an appropriate
 -- filename prefixed by a path, e.g., c:\MyFolder\MyTrace. The .trc extension
 -- will be appended to the filename automatically. If you are writing from
 -- remote server to local drive, please use UNC path and make sure server has
 -- write access to your network share
 exec @rc = sp_trace_create @TraceID output, 0, N'InsertFileNameHere', @maxfilesize,NULL
 if (@rc != 0) goto error
 -- Client side File and Table cannot be scripted
 -- Set the events
 declare @on bit
 set @on = 1
 exec sp_trace_setevent @TraceID, 16, 7, @on
 exec sp_trace_setevent @TraceID, 16, 15, @on
 exec sp_trace_setevent @TraceID, 16, 4, @on
 exec sp_trace_setevent @TraceID, 16, 8, @on
 exec sp_trace_setevent @TraceID, 16, 12, @on
 exec sp_trace_setevent @TraceID, 16, 60, @on
 exec sp_trace_setevent @TraceID, 16, 64, @on
 exec sp_trace_setevent @TraceID, 16, 9, @on
 exec sp_trace_setevent @TraceID, 16, 13, @on
 exec sp_trace_setevent @TraceID, 16, 41, @on
 exec sp_trace_setevent @TraceID, 16, 49, @on
 exec sp_trace_setevent @TraceID, 16, 6, @on
 exec sp_trace_setevent @TraceID, 16, 10, @on
 exec sp_trace_setevent @TraceID, 16, 14, @on
 exec sp_trace_setevent @TraceID, 16, 26, @on
 exec sp_trace_setevent @TraceID, 16, 3, @on
 exec sp_trace_setevent @TraceID, 16, 11, @on
 exec sp_trace_setevent @TraceID, 16, 35, @on
 exec sp_trace_setevent @TraceID, 16, 51, @on
 -- Set the Filters
 declare @intfilter int
 declare@bigintfilter bigint
 -- Set the trace status to start
 exec sp_trace_setstatus @TraceID, 1
 -- display trace id for future references
 select TraceID=@TraceID
 goto finish
 error:
 select ErrorCode=@rc
 finish:
go
Listing 2: Attention event server-side trace script generated by Profiler
Change the sp_trace_create statement (line 19) to specify the desired trace file path, rollover file option (option value 2) and add the number of rollover files desired (3 in this example). Be aware that the auto-generated sp_trace_create does not include the number of rollover files parameter, I covered these sp_trace_create options in detail in Level 2 of this Stairway. Listing 2 shows the customized sp_trace_create statement. The “C:\TraceFiles” folder must be created on the server before the trace is run.
exec @rc = sp_trace_create @TraceID output, 2, N'C:\TraceFiles\AttentionEvents', @maxfilesize,NULL, 3
Listing 2: sp_trace_create after customization
The @maxfilesize (set as 5MB in script line 11) doesn’t need to be changed for this trace. Together with the 3 rollover files specified, the total space needed for this trace will not exceed 15MB. Attention events typically do not occur frequently and 15MB is sufficient for over 100,000 of these records. For larger traces, you’ll want to increase the @maxfilesize and/or number of rollover files in order to facilitate trace file management and limit trace file space requirements. Remember that if the rollover option is specified without specifying the number of rollover files, SQL Trace will create new rollover files indefinitely. It’s a good habit to always add a rollover file limit in order to avoid accidentally filling the disk or cluttering the file system with old trace files.
Run the trace
Run the modified script to create and start the trace. Now that the trace is running, create an attention event by cancelling a WAITFOR DELAY '00:01:00' query running on the target instance. Run the query in listing 3 to view data collected by this trace.
SELECT *
 FROM fn_trace_gettable(N'C:\TraceFiles\AttentionEvents.trc', DEFAULT);
Listing 3: fn_trace_gettable query.
To stop and delete the attention event trace created in this walkthrough, modify the script in Listing 4 to specify the Trace ID of the attention event trace and run to stop and delete the trace. If you forgot to make note of the Trace ID retuned by the trace create script, query the sys.traces catalog view to identify the Trace ID with the “C:\TraceFiles\AttentionEvents.trc” path.
 DECLARE @TraceID int ;
 SET @TraceID = 3 ; -- specify value from sp_trace_create
 EXEC sp_trace_setstatus
    @traceid = @TraceID
    ,@status = 0 ;-- stop trace
 EXEC sp_trace_setstatus
    @traceid = @TraceID
  ,@status = 2 ;-- delete trace
Listing 4: Script to stop and delete attention event trace
Combining Data from Multiple Traces
I mentioned earlier that an attention event trace complements a long running query trace. Consider creating a long-running query trace script similar to the one in Level 2 of this Stairway but using the Profiler GUI. Include other relevant columns like Reads, CPU, ApplicationName, etc. Run both the attention event and long-running query traces concurrently in order to capture the events for correlation.
Listing 5 shows a query that combines data from 2 these traces using a UNION ALL query. Sample results from this query are shown in Figure 4. The attention event in the last row indicates that the preceding query on the same SPID was cancelled. Since the query duration was close to the default 30 second command timeout, it is likely that the cause for the attention event was a client-side query timeout. Query tuning is in order here to remediate this suboptimal query (perhaps you noticed the CONVERT function in the WHERE clause that prevents the index on the OrderEntryDateTime column from being used efficiently).
SELECT  te.name AS TraceEvent
        ,t.SPID
        ,t.TextData
        ,t.StartTime
        ,t.EndTime
 FROM   fn_trace_gettable(N'C:\TraceFiles\AttentionEvents.trc', DEFAULT)AS t
         JOINsys.trace_eventsAS te ON te.trace_event_id = t.EventClass
 UNION ALL
 SELECT  te.name AS TraceEvent
        ,t.SPID
        ,t.TextData
        ,t.StartTime
        ,t.EndTime
 FROM   fn_trace_gettable(N'C:\TraceFiles\LongRunningQueries.trc',DEFAULT) AS t
         JOINsys.trace_eventsAS te ON te.trace_event_id = t.EventClass
 ORDER BY t.SPID
      ,t.StartTime;
Listing 5: Combine long-running query and attention event data

Figure 4: Results of combined trace data
Summary
The SQL Server Profiler client tool compliments server-side tracing. The Profiler GUI allows one to create server-side trace scripts easily that gather your trace data less obtrusively than standard Profiler client-side tracing. With a few tweaks to the script generated by Profiler, server-side traces can run unattended to record events for proactive monitoring. Data from multiple traces may be combined for ad-hoc reporting, correlation and analysis. In Level 4, I’ll dig deeper into trace data querying while discussing the SQL Server default and blackbox traces.


