In this Level of the series, I begin some initial efforts to focus upon the vastly important subject of context. My intent will be shine a light onto the subject of context evaluation itself, while introducing over this and subsequent Levels, a handful of the primary DAX functions that afford us a means of manipulating context for sundry reasons. Each of these functions represents powerful capabilities within relatively straightforward packaging. In this sub-series, I will introduce each of these within a relatively simple scenario, primarily to “register” each into the body of the Stairway to DAX and Power BI series. We will return to each later when various needs arise for its respective capabilities, particularly when we need to call upon its power to context-shift for a given reason.
When we embark upon a discovery of how DAX works, we first try to obtain a rudimentary understanding of functions, with which we gain exposure to creating various calculations. We set out to craft measures and calculated columns to meet business requirements, largely within the realm of analysis and reporting. My experience was initially that the “learning curve” for DAX was quite comfortable, especially for someone with better-than-average exposure to Excel functions. DAX is a functional language, of course, and holds much in common with Excel – particularly in the fact that many Excel and DAX functions are similar, if not identical. This comes as no surprise, naturally, when we consider that Excel users are certainly targeted in the design and evolution of both Power Pivot and Power BI.
Before we have been working with DAX for any time at all, however, we encounter an “up angle” in that once initially comfortable learning curve: Evaluation context appears, typically unexpectedly (and rarely at a convenient time), and we find our existing understanding of DAX challenged. We soon learn that a grasp of context evaluation is critical to managing more complex requirements with sophistication. And, regardless of the ease with which a few prominent writers seem to describe how they have managed to grasp context in DAX, I am astounded at how often those who work with DAX well, and who understand it fluently, express surprise and frustration, in conversations among peers, when various DAX functions behave in ways they do not expect.
In this Level, I’ll introduce the All() function. I’ve seen All() described, more than once, as the primary “remove filters” function. All() enables us to clear existing filters, as we’ll see, and create calculations upon all rows in a specified table.
As a part of our introduction, we will examine basic ways in which we can employ All(). We’ll look at the function in standalone scenarios, as well as in situations where we’ll combine it with other functions, when appropriate, to meet the business requirements of clients, employers or peers in our own environments. As a part of our initial exploration of the All() function, we will:
- Examine the syntax involved in exploiting the function;
- Undertake illustrative examples of the basic use of the function in practice exercises;
- Briefly discuss the results datasets we obtain in each of the practice examples.
We will examine the output we obtain using All() within Power BI Desktop, in the practice session that follows our overview and explanation of the purpose and operation of the function. Because we’ll be examining ways, via the functions that we explore in this and other Levels of this sub-series, to manipulate context, we’ll be focusing upon measures (and not calculated columns) that put All() to work in Power BI Desktop visualizations we create. We’ll use these measures to further focus upon conditions where evaluation context is a factor.
NOTE: For an introduction to Power BI and Power BI Desktop, see “A Brief Introduction to Power BI and Power BI Desktop” in Stairway to DAX and Power BI - Level 10: Function / Iterator Function Pairs: The DAX Product() and ProductX() Functions, where I recognize the evolving nature of PowerPivot and the other “power” components of Excel, and reflect upon their absorption into Power BI. As we note there, and in subsequent Levels of this series, we will be working largely within Power BI Desktop. There are many advantages to this approach, including our employment of a tool that will be pervasive, which evolves with monthly releases (not the case with Microsoft Office Excel), and which is free and easy to use for all readers, including those that do not have recent versions of Excel.
In Stairway to DAX and Power BI - Level 10: Function / Iterator Function Pairs: The DAX Product() and ProductX() Functions, I also offer guidance on preparation for the Levels of Stairway to DAX and Power BI, including the installation of Power BI Desktop and DAX Studio, as well as guidance in keeping Power BI Desktop updated for new updates.
Preparation for the Practice Exercises in this Level
Once you’ve installed Power BI Desktop, you are ready to download and open the Power BI Desktop file that we will use for hands-on practice with the concepts we introduce.
Download Samples for Use in this Level
To prepare to complete the steps of the hands-on practice in this Level, you’ll need to download the sample Power BI file we’ll be using. The project from which this sample file comes “contains accelerators for partners and customers to quickly get set up with enterprise ready dashboards and solutions.” (For more info about the larger project, see https://github.com/Microsoft/Power-BI-Solution-Template .)
For our purposes, we need only download the related .pbix file, so we’ll have a small amount of somewhat realistic data with which to complete this level – data that is already imported so that all readers can access the data without having to import it from applications and data sources to which they may not have access, and so forth.
Go here and click the “Download” button a little over halfway down the page:
Sales Management Demo .pbix File
Because data in the file has already been imported, we won’t be able to connect to the data source or view it in Query Editor. (We will import data directly in Levels of this series where we need to be able to accomplish this, and other requirements that go beyond working with DAX, in simple, isolated scenarios.)
Once the sample .pbix file is downloaded, we’ll take the following steps to open it in Power BI Desktop. This will put us in position to begin learning the material in this Level.
- Open Power BI Desktop.
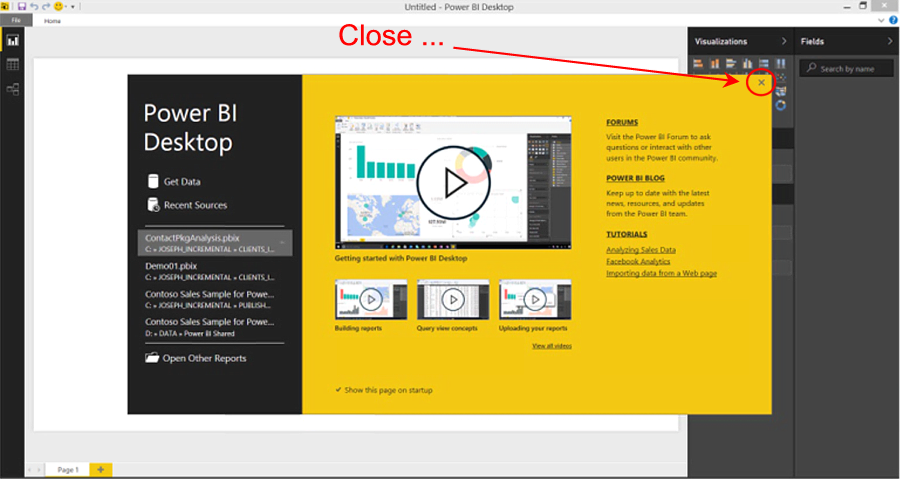
- Click the “X” button in the upper right corner of the splash dialog that appears upon entry, atop the Power BI Desktop interface, as shown.

Illustration 1: Close the Splash Dialog that Appears in Power BI
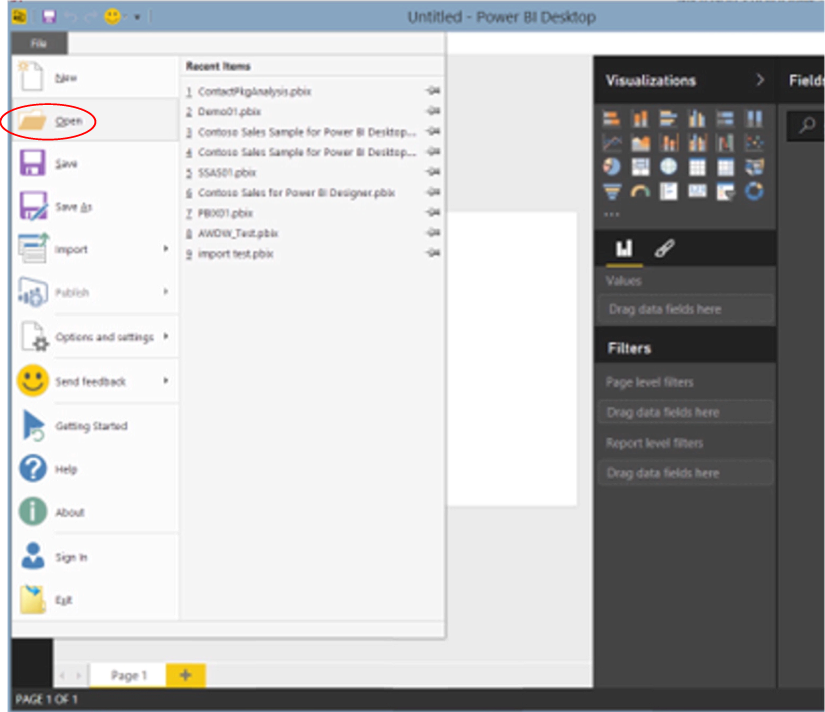
- Select File - Open from the main menu.

Illustration 2: Select File - Open in Power BI
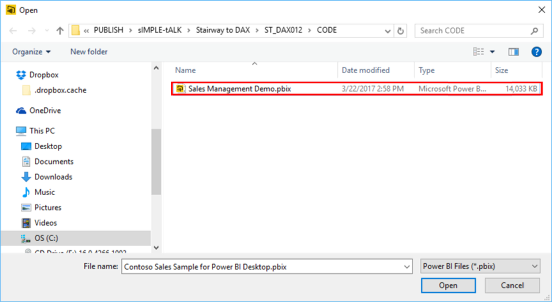
- Locate and open the downloaded sample file, Sales Management Demo.pbix, from the Open dialog, as shown.

Illustration 3: Select the Sample File …
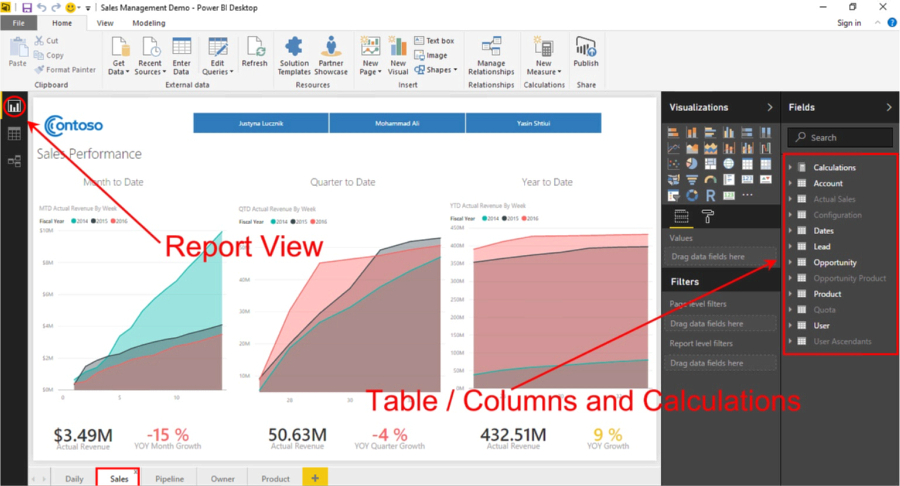
- Click Open.The .pbix file opens and we arrive within the Report view.
- Click on the Sales tab (the second from the left at the bottom of the Report view).At this stage, we can see a few pre-configured reports, as well as the model’s member tables, etc., within the Fields pane on the right side of the desktop.

Illustration 4: The Model Opens in Power BI Desktop (Sales Tab)
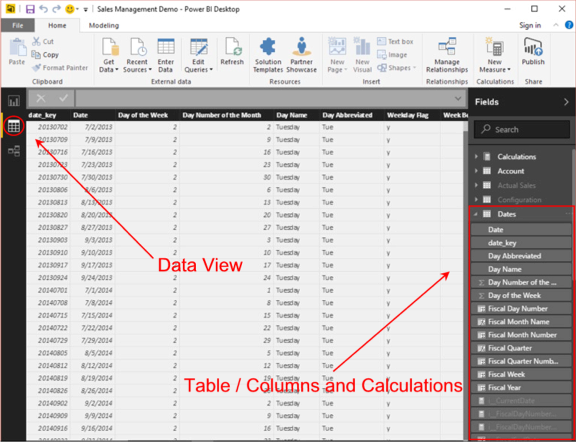
Let’s leave the Report view (our current position in Power BI Desktop, which is indicated by the yellow bar that appears to the immediate left of the Report view icon), and look over the newly opened model from the tandem perspectives of Data and Relationships.
- Click the Data view icon along the left of Power BI Desktop (the middle of the three icons).The data for one of the tables listed in the Fields pane on the right of the desktop appears partially below.

Illustration 5: Power BI Desktop Data View
We can examine each table, as well as add columns and calculations, within this and Report views, as we see throughout prospective Levels of this Stairway.
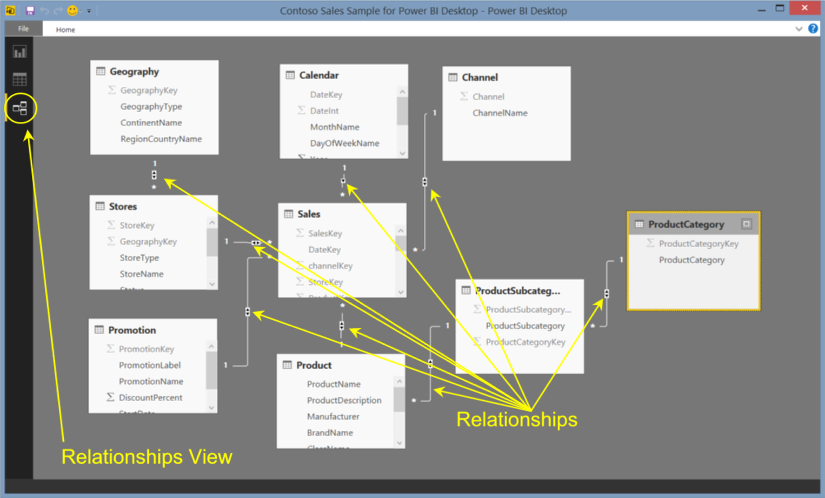
- Click the Relationships view icon next, just below the Data view icon we last clicked.The schema, with relationships between tables, appears.

Illustration 6: Relationships View
The All() Function
Introduction
According to the Microsoft Developer Network (MSDN), the DAX All() function “returns all the rows in a table, or all the values in a column, ignoring any filters that might have been applied.” The part about “ignoring filters” is important: All() is highly useful when it comes to clearing filters and creating calculations that involve all the rows in a table.
I most typically use All()within the Calculate() function (we explore Calculate() in other Levels within this series), but we’ll be looking at its standalone use within the examples of this article, mainly to gain a clear understanding of how it operates in simple situations. Like the Calculate() function, the All() function appears very simple, at first glance, to many of us. The examples in this Level will reinforce, to some extent, this apparent straightforwardness, but we will see growing levels of complexity using All() emerge within other Levels of this Stairway.
All() can work with either a table or a column as a parameter, as we’ll see going forward. Whichever parameter we choose, however, All() always returns a table. All(), like other DAX functions (as most of us are aware), is displayed as a selection in the Power BI Desktop Formula bar that appears when creating a new column or a new measure. The function is often used in combination with other DAX functions – again, mostly within the Calculate() function.
We’ll further explore the syntax for the All() function after a brief discussion in the next sections. We’ll then perform a brief walkthrough to show the function at work. Finally, within the Practice section later in this Level, we’ll gain some hands-on exposure to the use of All(), within a couple of practice examples constructed to support hypothetical business needs. This should enable us to activate what we explore in the Discussion and Syntax sections.
Discussion
DAX supports our needs to “shift context” within the filter context, thus clearing filters and creating calculations on all the rows in a table. All() is one of the functions DAX provides for this purpose. As we’ve already discussed, the All() function is typically found in service as an intermediate function, versus by itself, in its capacity to change the set of results over which some other calculation is performed.
Syntax
Syntactically, in using the All() function to ignore filters that are in effect, and to return all the rows in a table, or all the values in a column, we specify the table or column for which filter context is to be ignored to the right of the All keyword, as shown here:
=ALL( {<table> | <column>[, <column>[, <column>[,…]]]} )
When using the All() function with a table or a column, we must specify either a reference to a base table or a reference to a base column, respectively. We cannot use table expressions or column expressions with the All() function.
All() returns a table containing the table or column we have specified in the arguments, with filters removed.
Let’s get some practical exposure in the section below. To get started, we’ll create a basic scenario where a simple filter context is in place. We’ll then use the All() function to override that context to “reset” specific values to their non-filtered states.
Practice
To reinforce our understanding of the basics, we’ll put the All() function to work within the step-by-step definition of some calculations. Our approach will be to do this somewhat as we have in the other Levels of this Stairway series, but we’ll be working solely with measures in this Level, as a calculated column, by its very nature, can only have row context in the first place.
First, we’ll do a little preparation and set up a matrix within which a definite filter context exists. Then we’ll add a calculation that leverages the All() function to shift the context in place back to the “all” (filter-less) context. We’ll work largely within straightforward matrix visualizations in the Report view of the Power BI Desktop model we prepared earlier as a platform from which to construct and execute the DAX we examine, and to view the results we obtain.
Create a Simple Filter Context
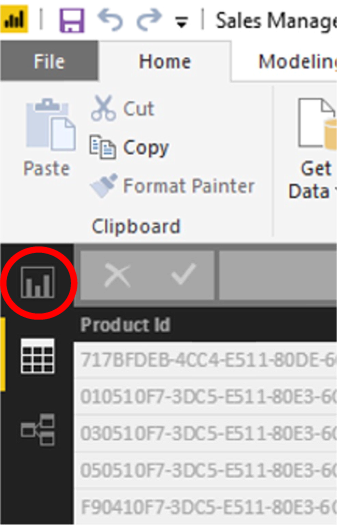
- From wherever we might be within Power BI Desktop, click the Report view icon in the left navigation bar:

Illustration 7: Go to the Report View in Power BI Desktop …
- Click the tab marked with the “+” sign, to the right of the existing tabs, to arrive at a blank canvas.Here we will construct a Matrix visualization to meet some hypothetical requirements. As is always the case within the highly flexible Power BI Report view, we’ll be able to construct working visualizations while building the calculations those visualizations will contain. The sheer convenience of being able to access the model structure while within the Reports view, and having the flexibility to see the model in action as we design it, makes Power BI Desktop an excellent platform from which to prototype solutions.
- Click at some point on the new, blank canvas we have just created.
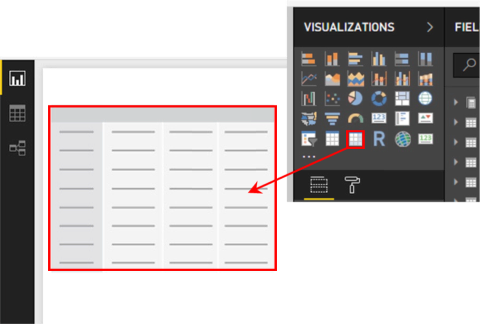
- Click the Matrix visualization inside the Visualizations collection to the right of the canvas.An empty Matrix appears on the canvas, as shown:

Illustration 8: Adding a Matrix to the Canvas (Composite View) …
- Drag the Matrix that appears toward the upper left corner of the canvas, as necessary.
- With the Matrix still selected, expand the Product table in the Fields section to the right of the Visualizations section.
- In the Fields pane, select the Product Level 1 column (by clicking its checkbox) that appears underneath the expanded Product table.The name of Contoso’s Product Level 1, “Electronics,” populates the top row of the new Matrix.
- Drag the Product Level 2 column from the Product table, as well, dropping it under Product Level 1 in the Rows section, underneath the Visualizations group on the ribbon, as shown.

Illustration 9: Adding Fields to the Rows Definition …
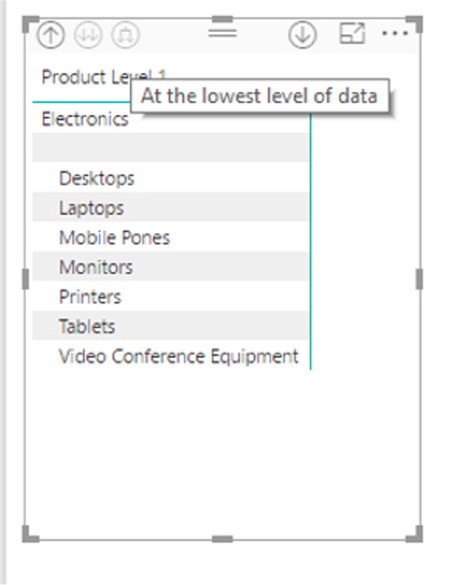
- Click the right-most of the three circles, containing two downward-pointing arrows, in the upper left corner of the Matrix visualization we have just begun populating.This “expands all down” one hierarchical level, and thus both Product Levels we have added are displayed.

Illustration 10: Displaying Both Product Levels …
Next, let’s create a calculation to generate total number of products for each of the Product Level 2 rows in our matrix.
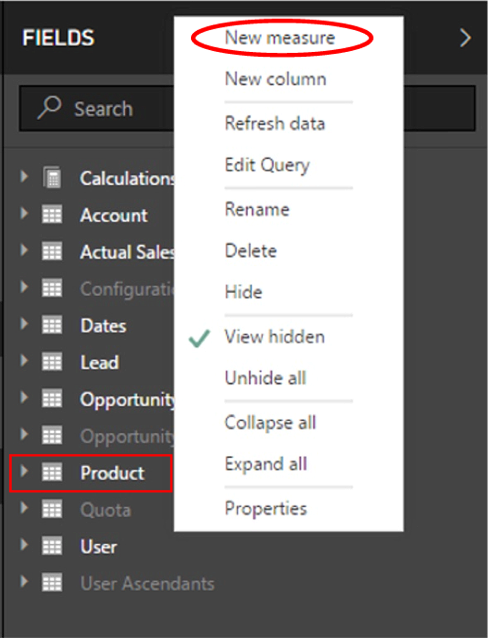
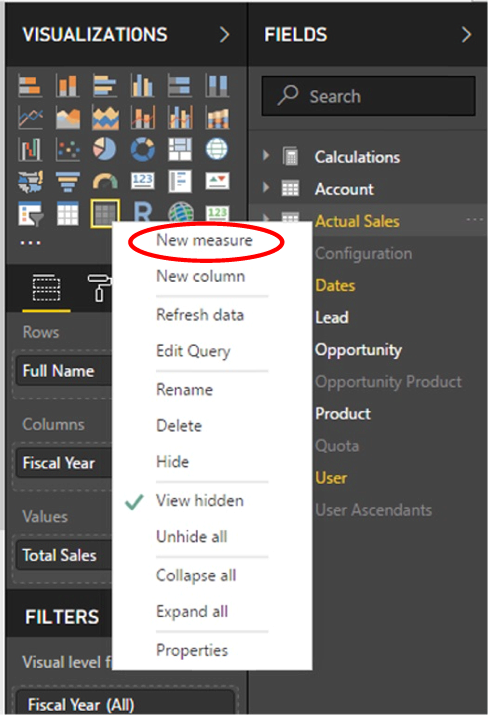
- Right-click the Product table in the Fields area of Power BI Desktop.
- Select New measure from the context menu that appears, as shown:

Illustration 11: Creating a New Measure …
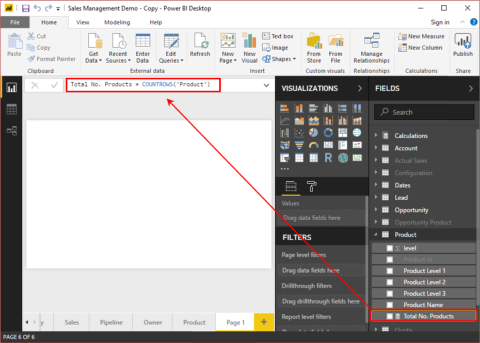
- Replace the default “Measure = “ in the formula bar that appears atop the Report canvas with the following:
Total No. Products = COUNTROWS('Product')NOTE: For more information on the CountRows() function, see Level 2: The DAX CountRows() and Filter() Functions, within this Stairway series.
- Click the checkmark to the left of the formula bar to check syntax and create the measure.Our new measure, as defined in the formula bar, appears in the Product table as shown.

Illustration 12: The Total No. Products Measure Appears …
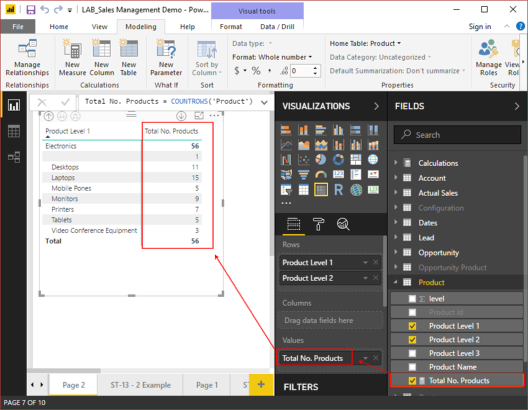
- Click the checkbox to the immediate left of the new Total No. Products measure in the Product table.The measure is added to the Values area, underneath the Visualizations collection, and appears within the Matrix visualization on the corresponding Product Level rows, as we see here:

Illustration 13: Total No. Products Measure in the Matrix
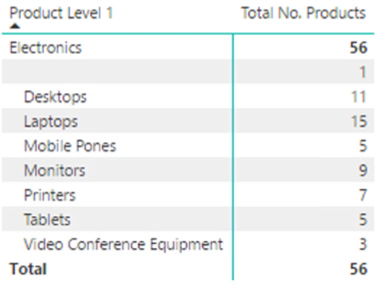
We have now created a filter context: Product Levels 1 and 2 are filtering the total product rows (the value is 56 for all Product Level 2’s). The Level 2’s on the rows form filters, and, for each, the Total No. Products measure returns the count that survives each filter.

Illustration 14: Total No. Products Measure, with Filter Effects on the Rows
(The blank row contains a Product that is not assigned to one of the Level 2’s. To be kind, we might assume that this circumstance, together with the misspelling of “Phones” in the Product Level 2 Names, as seen in the Matrix, perhaps reflects not haphazardness in design, but an attempt to simulate “real world” data ….)
Now that we have established a filter context, let’s see how we can perform a simple override of that context.
Perform a Simple Context Shift Using the DAX All() Function
We’ll perform a simple context shift with another measure we’ll create. We’ll see the DAX All() function at work in this basic example.
- Right-click the Product table in the Fields area of Power BI Desktop, once again
- Select New measure from the context menu that appears, as we did earlier.
- Replace the default “Measure = “ in the formula bar with the following:
Total No. All Products = COUNTROWS(ALL('Product')) - Click the checkmark to the left of the formula to check syntax and create the measure.
- Click the checkbox to the immediate left of the new Total No. All Products measure in the Product table.
The measure is added to the Value area, underneath the first measure we added, and appears within the Matrix visualization on the corresponding Product Level rows, as we see here:
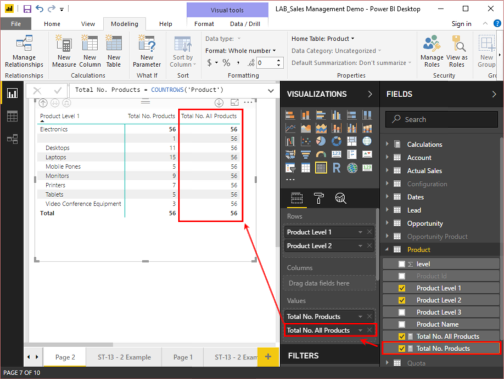
Illustration 15: Total No. All Products Measure Joins the Matrix …
Our new Total No. All Products measure overrides the mechanical context of the Matrix visualization and shifts the values to the “All” level. In the following calculation:
COUNTROWS(ALL('Product'))
… we use All() to clear the filter for each respective row and “hardcode” the count of all rows into the table.
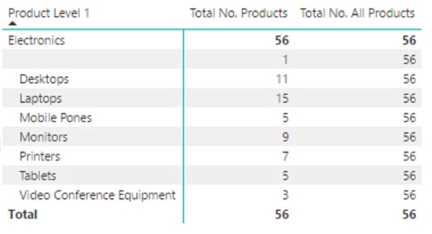
Illustration 16: Total No. All Products Measure Overrides Filter Context of Total No. Products
We’ve walked through a simple filter context shift at this point, where we simply demonstrated All() at works in the most basic scenario, side-by-side with a calculation that fully obeys filter context for comparison purposes. It should be quite intuitive how this might be useful, particularly in situations where one might need to manipulate a denominator, say, in a ratio where we seek to generate a “percentage-of-total” / “percentage-of-ultimate-parent”, or other “contribution-to-whole” concept. In our next example, we’ll do exactly that.
Create another Simple Filter Context
Now that we’ve gotten a little hands-on exposure to the use of All(), let’s take our examination of shifting context into the more commonly useful instance to which we’ve alluded. In this case, we’ll look at the performance of Users in a hypothetical organization – specifically, we’ll perform an analysis of their “contribution to the whole,” where, unsurprisingly, we’ll want to generate a filtered value (the value for which a given individual is responsible), alongside the ratio of the individual’s value to the total value generated by all participants within the organizational whole. This is the classic “contribution analysis” scenario that is pervasive in business, for a wide array of participating inputs.
- From our current position within Power BI Desktop, ensure that we are in the Report view.
- Create another blank canvas by clicking the tab marked with the “+” sign, to the right of the existing tabs, as we did in preparing for our first example earlier.
- Click at some point on the new, blank canvas.
- Click the Matrix visualization, once again, inside the Visualizations collection to the right of the canvas.An empty Matrix appears on the canvas, as shown in Illustration 8 above.
- Drag the Matrix toward the upper left corner of the canvas, as necessary.
- With the Matrix still selected, expand the User table in the Fields section to the right of the Visualizations section.
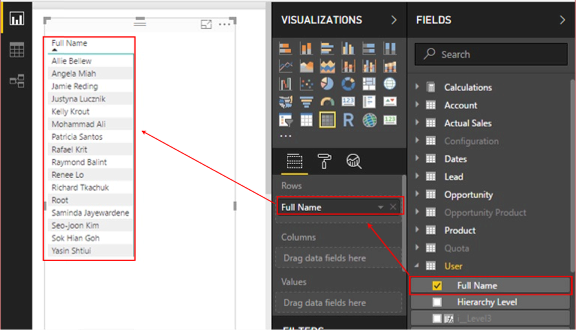
- In the Fields pane, select the Full Name column (by clicking its checkbox) which appears atop the list of columns that are exposed underneath the expanded User table.The full names of the Users populate (by default) the rows of the Matrix, as depicted.

Illustration 17: Adding Users Field to the Rows Definition …
- Right-click the Actual Sales table in the Fields section.
- Select New Measure from the context menu that appears, once again.
- Replace the default “Measure = “ in the formula bar that appears atop the Report canvas with the following:
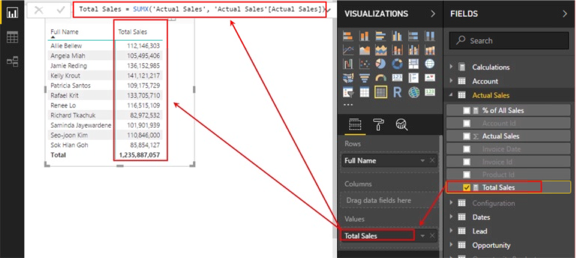
Total Sales = SUMX('Actual Sales', 'Actual Sales'[Actual Sales]) - Click the checkmark to the left of the formula to check syntax and create the measure.
- Click the checkbox to the immediate left of the new Total Sales measure in the Actual Sales table.The measure is added to the Value area, and appears within the Matrix visualization on the corresponding User rows, as we see here:

Illustration 18: Total Sales Measure in the Matrix
In the Total Sales measure, we employ the DAX SumX() function to return a Total Sales sum for each row in the table we have created within our Matrix visualization. Here we have filter context enforced again, as is obvious.
NOTE: For more information on the SumX() function, see Level 6: Function / Iterator Function Pairs: The DAX SUM() and SUMX() Functions, within this Stairway series.
- With the Matrix still selected, expand the Date table in the Fields section.
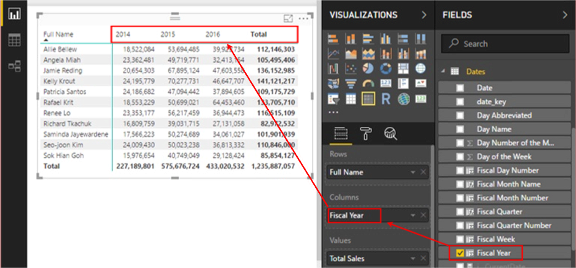
- Drag the Fiscal Year column that appears underneath the expanded Date table to the Columns section, underneath the Rows section, as depicted.

Illustration 19: Placing Fiscal Years atop the Columns of the Matrix …
If you haven’t formatted the measure as above already, it’s easy to accomplish.
- With the new Total Sales measure highlighted (within the Fields section, under the expanded Actual Sales table), select the Modeling tab atop the Power BI Desktop toolbar.
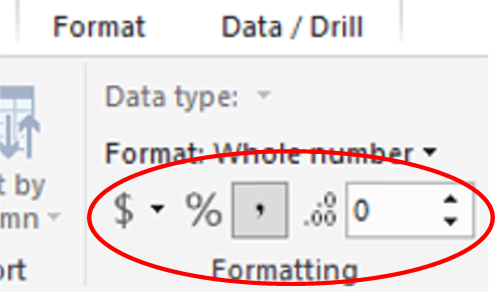
- About midway across the toolbar, underneath the blank Datatype selector, click-select the box containing “,” (a comma), and leave the default “0” (zero) in the decimal point selector to the far right of the “,” box, as shown.

Illustration 20: Format the New Measure with Comma (“,”) Separator
The Fiscal Years in the data set form individual columns (with heading labels) within the Matrix – the columns represent new Fiscal Year context filters, of course. The respective year values for Total Sales, together with an additional Total column (by default), appear.
Selectively Shift Context within a Part of a Calculation using the DAX All() Function
Now that we’ve constructed another simple filter context, let’s look at using the DAX All() function within a “contribution” calculation we create. We have generated filtered totals for Total Sales by individuals and fiscal years. Next, we’ll see how All() can assist us in calculating the percentage of each of those individual’s sales relative to the total sales for each year, as well as to the total sales for all years under our observation in the matrix visualization we have created.
Let’s get started with a new calculation, % of Total Sales.
- Right-click the Actual Sales table in the Fields section.
- Select New Measure from the context menu that appears, once again.

Illustration 21: Creating Another New Measure …
- Replace the default “Measure = “ in the formula bar that appears atop the Report canvas with the following:
% of Total Sales = SUMX('Actual Sales', 'Actual Sales'[Actual Sales]) / SUMX(ALL('Actual Sales'),'Actual Sales'[Actual Sales]) - Click the checkmark to the left of the formula to check syntax and create the measure.This is a suitable time, once again, to format the value, as we know we want it to reflect a percentage.
- With the new % of Total Sales measure highlighted, select the Modeling tab atop the Power BI Desktop toolbar.
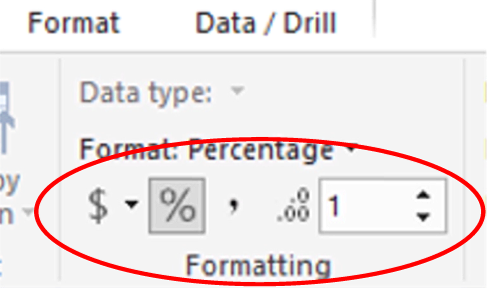
- Around midway across the toolbar, underneath the Data type selector, click-select the box containing “%” (percentage symbol), and select “1” in the decimal point selector to the right of the % box, as depicted:

Illustration 22: Format the New Measure as a Percentage
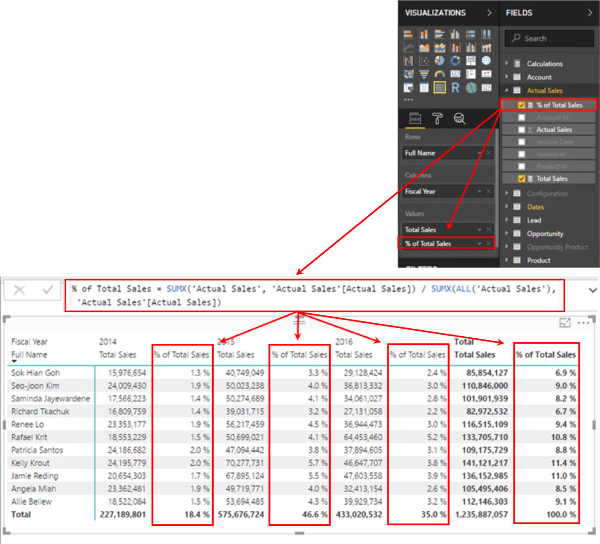
- Click the checkbox to the immediate left of the new % of Total Sales measure in the Actual Sales table.The % of Total Sales measure is added to the Value area, as expected, and appears within the Matrix visualization on the corresponding User rows, alongside the corresponding Total Sales measure, as shown.

Illustration 23: The % of Total Sales Measure Appears in Each Year Column
In the above case, we see a shift of context in the denominator of the % of Total Sales measure. This shift is brought to us courtesy of the All() function, which we use in the denominator of our percentage calculation, as shown:
  SUMX('Actual Sales', 'Actual Sales'[Actual Sales]) /

 SUMX(ALL('Actual Sales'),'Actual Sales'[Actual Sales])
As we’ve noted, setting a denominator to a value for “all members” like this is no doubt one of the more popular uses of the All() function. It’s easy to see, in this simple scenario, how the function re-sets context to ignore the filters enforced at the levels of the individual matrix rows (that is, sets to an “All” context the very value that is filtered by User in the numerator), within the context of the Fiscal Year, as we have chosen to break it out. The two Total columns to the right, and the Total row at the bottom, are default features of the Matrix visualization itself, and can be disabled by modifying settings in the Subtotals and Grand total areas of the Format tab underneath the Visualizations section, as depicted.
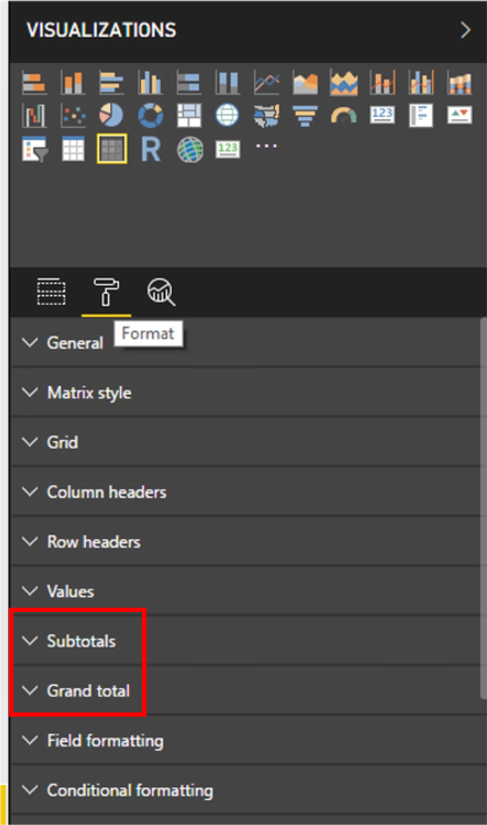
Illustration 24: Subtotals and Grand Total Settings for the Matrix Visualization
I hope that the two simple exercises we have undertaken together in this Level have helped to illustrate the operation of the DAX All() function, and how it allows us to shift context to meet a couple of simple needs. Now that we’ve grasped the most rudimentary basics of the function, we’ll be prepared to move to scenarios where we use All() within, or otherwise in conjunction with, other DAX functions. Seeing All() in action on its own, initially, is a great way to get started with context-shifting concepts – as I noted earlier – before moving into multi-faceted ways to more precisely control context using advanced approaches.
Summary …
In this Level of the Stairway to DAX and Power BI series, we performed an introduction to the DAX All() function. We discussed the purpose, syntax and operation of the function, and then focused upon using it to meet a couple of simple needs to shift context.
As we do with every DAX function we introduce within the Stairway to DAX and Power BI series, we undertook illustrative examples of the use of All() in practice exercises, and then observed the results datasets we obtained. We concentrated upon considerations surrounding simple context manipulation, extending our exploration of All() to the delivery of illustrative answers to business questions, within the model and visualization levels of Power BI.

