SQL Server 2012 execution plans show more information about parallel thread usage. This can be useful where your SQL Server instance is reaching the limits of worker threads and you want to look for plans with higher worker thread reservations. What’s useful about this additional information is that it can reveal unexpected consumption of threads due to multiple branches in your execution plan, as I’ll demonstrate in this article.
To illustrate how to get to, and use, this information, let’s walk through an actual parallel execution plan on a SQL Server 2012 instance (version 11.0.2100 to be specific). I’ll lower the cost threshold for parallelism to a value of “1” in order to invoke a parallel plan on my SQL Server instance. If you decide you would like to follow along, be sure to set it back to the previously configured value after you’ve finished.
EXEC sp_configure 'show advanced options', 1;
RECONFIGURE;
-- Normally I keep this at the default, but am setting for this article
EXEC sp_configure 'cost threshold for parallelism', 1;
RECONFIGURE;
EXEC sp_configure 'show advanced options', 0;
RECONFIGURE;
Next I'll execute the following query against the AdventureWorksDW2012 database:
USE AdventureWorksDW2012;
SELECT p.ProductLine,
SUM(f.SalesAmount) AS TotalSalesAmount
FROM [dbo].[FactInternetSales] AS f
INNER JOIN [dbo].[DimProduct] AS p ON
f.ProductKey = p.ProductKey
GROUP BY p.ProductLine
ORDER BY p.ProductLine;
This returns the following result set:

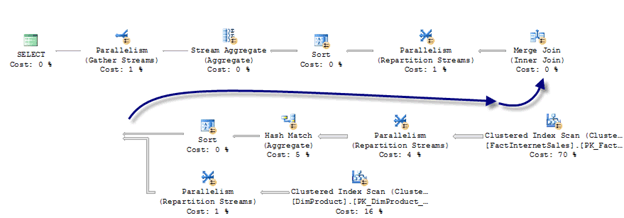
When I include the actual graphical query execution plan along with the results, I see that the query executed as a parallel plan (I’ve wrapped around the graphical execution plan for readability purposes):

I know visually that this plan ran in parallel because I see the Parallelism operators (Repartition, Gather Streams) and also the yellow circle with two arrows in each operator that executed with parallelism.
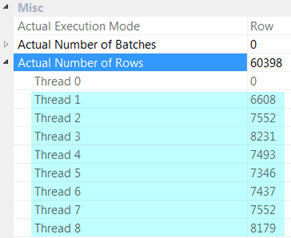
Within the graphical execution plan window of SQL Server Management Studio, I can see more detailed information by clicking the operator I’m interested in , and selecting the properties pane (click F4 to show it or select the “View” menu and select “Properties Window”). For example, to get the information displayed below, I have selected the Clustered Index Scan operator and expanded the Actual Number of Rows to see how the rows were distributed over the query execution parallel threads:

I also see that eight threads were used for this one operator.
Additionally, in the properties pane, I can see that the Parallel attribute for this operator is “True”:

I can then work through the parallelism details in XML textual form by Right-clicking the execution plan surface area and selecting “Show Execution Plan XML…” . The QueryPlan element shows that the DegreeOfParallelism is set to “8”:
<QueryPlan DegreeOfParallelism="8" MemoryGrant="21632" CachedPlanSize="48" CompileTime="11" CompileCPU="11" CompileMemory="464">
After the QueryPlan element, we see the new SQL Server 2012 thread statistics:
<ThreadStat Branches="3" UsedThreads="24">

<ThreadReservation NodeId="0" ReservedThreads="6" />

<ThreadReservation NodeId="1" ReservedThreads="6" />

<ThreadReservation NodeId="2" ReservedThreads="6" />

<ThreadReservation NodeId="3" ReservedThreads="6" />

</ThreadStat>
The “ThreadStat” element has two attributes associated with it:
- “Branches” – which provides the count of concurrent execution paths within a query execution plan
- “UsedThreads” – returns the maximum count of used parallel threads
The child element “ThreadReservation” has two attributes that break out thread reservations by NUMA node:
- “NodeId” – the NUMA node ID
- “ReservedThreads” – the count of parallel threads for the specified NUMA node
What does this additional information tell us based on the example query I executed?
- The query execution plan has three paths, or branches, of execution.
- The “UsedThreads” attribute tells us that there were 24 used threads for this query. Note that I didn’t say you had 24 concurrently executing threads, since the maximum degree of parallelism was 8.
- The “ReservedThreads” further confirms the 24 threads needed for this query.
- The reserved threads were split evenly over each of the four NUMA nodes.
After the “ThreadStat” element information we also have the “OptimizerHardwareDependentProperties” element:
<OptimizerHardwareDependentProperties EstimatedAvailableMemoryGrant="102400" EstimatedPagesCached="51200" EstimatedAvailableDegreeOfParallelism="4" />
Within that element, the “EstimatedAvailableDegreeOfParallelism” attribute shows us that half the actual schedulers were used in costing the plan.
After that, we’ll see the various “RelOp” elements and their associated “Parallel” attributes indicating whether the operator was running in parallel or serial modes. For example, the “Stream Aggregate” physical operation was running in parallel:
<RelOp AvgRowSize="19" EstimateCPU="7.7625E-05" EstimateIO="0" EstimateRebinds="0" EstimateRewinds="0" EstimatedExecutionMode="Row" EstimateRows="5" LogicalOp="Aggregate" NodeId="1" Parallel="true" PhysicalOp="Stream Aggregate" EstimatedTotalSubtreeCost="2.15162">
Furthermore, this parallel executing operator is followed by runtime information of actual rows per thread (the following shows rows per thread for the Stream Aggregate operator:
<RunTimeInformation>

<RunTimeCountersPerThread Thread="8" ActualRows="0" Batches="0" ActualEndOfScans="1" ActualExecutions="1" ActualExecutionMode="Row" />

<RunTimeCountersPerThread Thread="7" ActualRows="1" Batches="0" ActualEndOfScans="1" ActualExecutions="1" ActualExecutionMode="Row" />

<RunTimeCountersPerThread Thread="4" ActualRows="1" Batches="0" ActualEndOfScans="1" ActualExecutions="1" ActualExecutionMode="Row" />

<RunTimeCountersPerThread Thread="6" ActualRows="0" Batches="0" ActualEndOfScans="1" ActualExecutions="1" ActualExecutionMode="Row" />

<RunTimeCountersPerThread Thread="1" ActualRows="2" Batches="0" ActualEndOfScans="1" ActualExecutions="1" ActualExecutionMode="Row" />

<RunTimeCountersPerThread Thread="5" ActualRows="0" Batches="0" ActualEndOfScans="1" ActualExecutions="1" ActualExecutionMode="Row" />

<RunTimeCountersPerThread Thread="3" ActualRows="0" Batches="0" ActualEndOfScans="1" ActualExecutions="1" ActualExecutionMode="Row" />

<RunTimeCountersPerThread Thread="2" ActualRows="0" Batches="0" ActualEndOfScans="1" ActualExecutions="1" ActualExecutionMode="Row" />

<RunTimeCountersPerThread Thread="0" ActualRows="0" ActualEndOfScans="0" ActualExecutions="0" />

</RunTimeInformation>
Getting back to the new elements and attributes that were introduced in SQL Server 2012, why should we care about thread reservations, branches and used threads?
This information may be valuable to you in situations where you’re reaching your worker thread limits on a SQL Server instance. Even when we’re using a maximum of 8 schedulers at a time for a single query execution, you are still reserving additional parallel threads for use during the lifecycle of the query execution: This will include at least another coordinator thread, but if there are several branches, even more threads than you might have anticipated.
Let’s say I cap my degree of parallelism to “4” for the previous example query. What stats would we expect to see for thread reservation? In this case, the “QueryPlan” element shows me that the value of my maximum degree of parallelism is “4”:
<QueryPlan DegreeOfParallelism="4" MemoryGrant="8864" CachedPlanSize="48" CompileTime="11" CompileCPU="11" CompileMemory="464">
For the thread statistics, I still have three branches in my plan, but the “UsedThreads” is reduced down to “12” from the original “24”. We’re also only making use of two NUMA nodes:
<ThreadStat Branches="3" UsedThreads="12">

<ThreadReservation NodeId="0" ReservedThreads="6" />

<ThreadReservation NodeId="1" ReservedThreads="6" />

</ThreadStat>
I can execute the following query in a separate session to monitor the workers allocated to a specific session (in this case, my session id is 56):
SELECT COUNT(*)AS worker_count
FROM sys.dm_os_workers AS w
INNER JOIN sys.dm_os_tasks AS t ON
w.task_address = t.task_address
WHERE t.session_id = 56;
In a case of the query I’ve been using in this article, with a max degree of parallelism of 8 and three parallel execution branches, the previous query against sys.dm_os_workers and sys.dm_os_tasks returns 25 workers. That breaks out as follows:
- 8 workers (branch 1)
- 8 workers (branch 2)
- 8 workers (branch 3)
- 1 coordinator thread
So with the new parallel thread usage information introduced in the SQL Server 2012 execution plan, we can see better the true thread reservations for a query and not just information on the maximum degree of parallelism and row distribution across parallel threads.
As a final note, if you were testing out this query, don’t forget to put your cost threshold for parallelism back to the pre-testing value. For example:
EXEC sp_configure 'show advanced options', 1;
RECONFIGURE;
-- Normally I keep this at the default, but am setting for this article
EXEC sp_configure 'cost threshold for parallelism', 5;
RECONFIGURE;
EXEC sp_configure 'show advanced options', 0;
RECONFIGURE;


