I was checking the monitoring of SQL Server Central through the public web site (where you can all see it) when I noticed that the CPU on one of the machines was sitting at about 90% capacity.
I’m new to these machines, so I wasn’t sure if that was normal or not. And, even if it was normal, it’s not exactly good. So I immediately went to the Analysis page of SQL Monitor. First thing I checked was today versus yesterday and you can see that here.
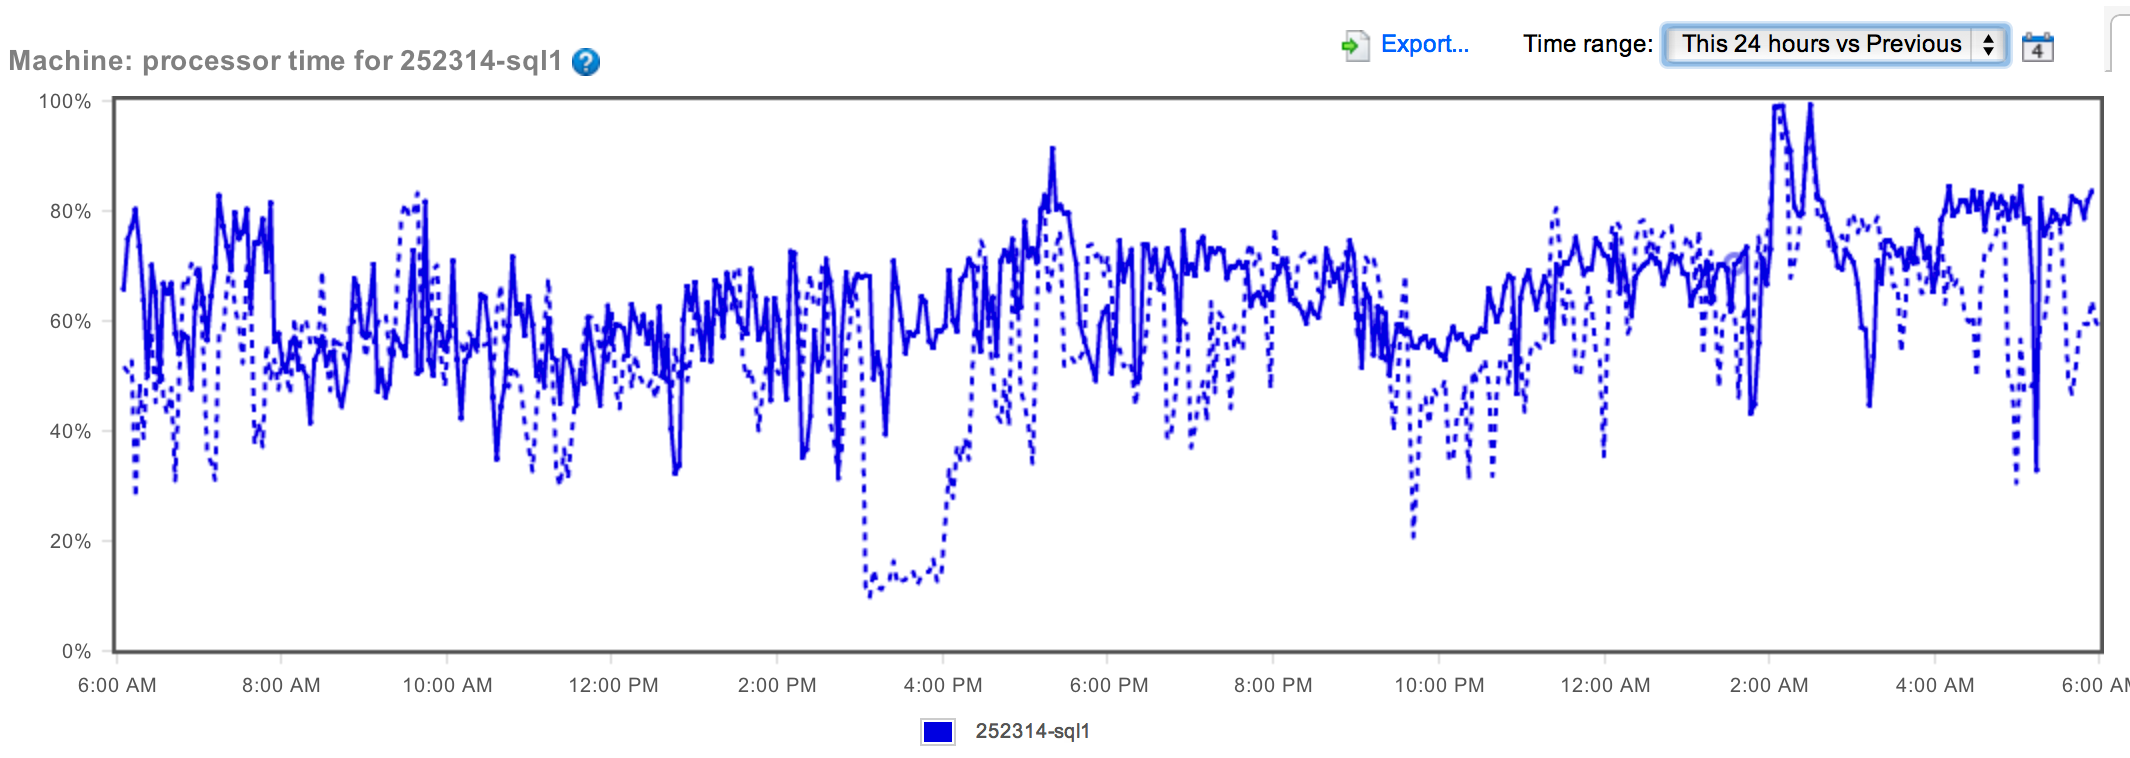
The difference between the two wasn't that great. In fact, if you look at it, you can spot similar peaks and valleys. But there did seem to be a slight increase in CPU over the last 24 hours. What we need is more information. How about comparing this week to last week:
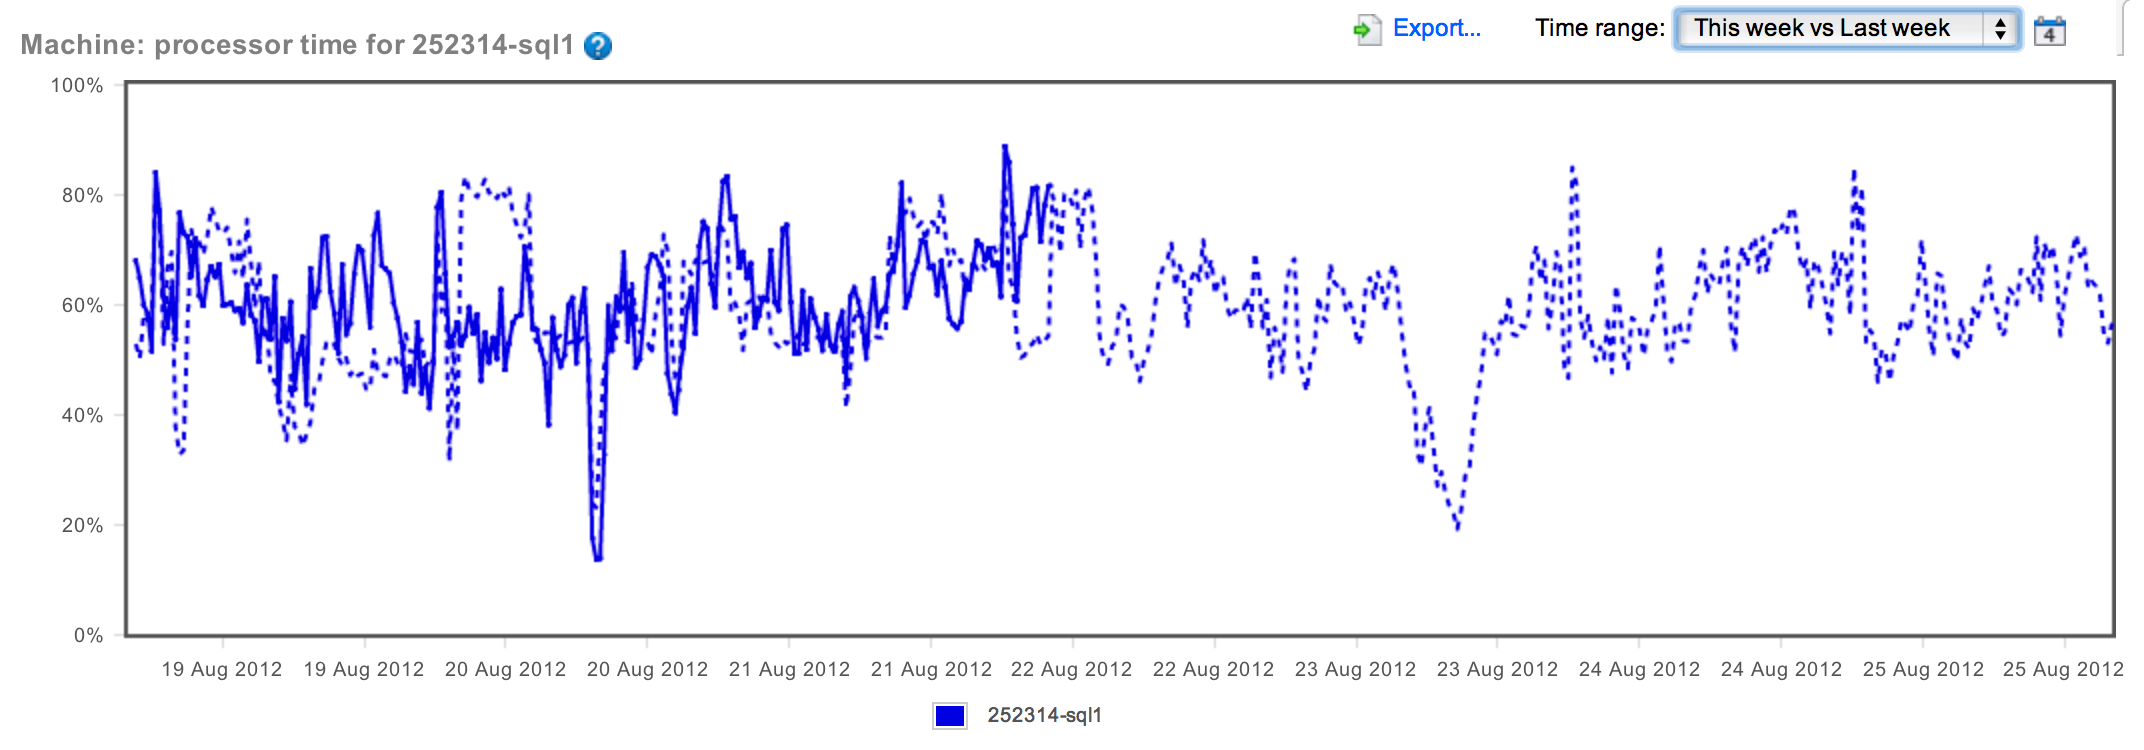
Whoa! OK. We're not seeing an increasing CPU. In fact, the CPU is eerily maintaining very identical peaks and valleys (for the most part), showing that behavior of the CPU is consistent. Whether it's good or not remains to be seen. Just to finish this line of thought, I went ahead and compared this month to last month:
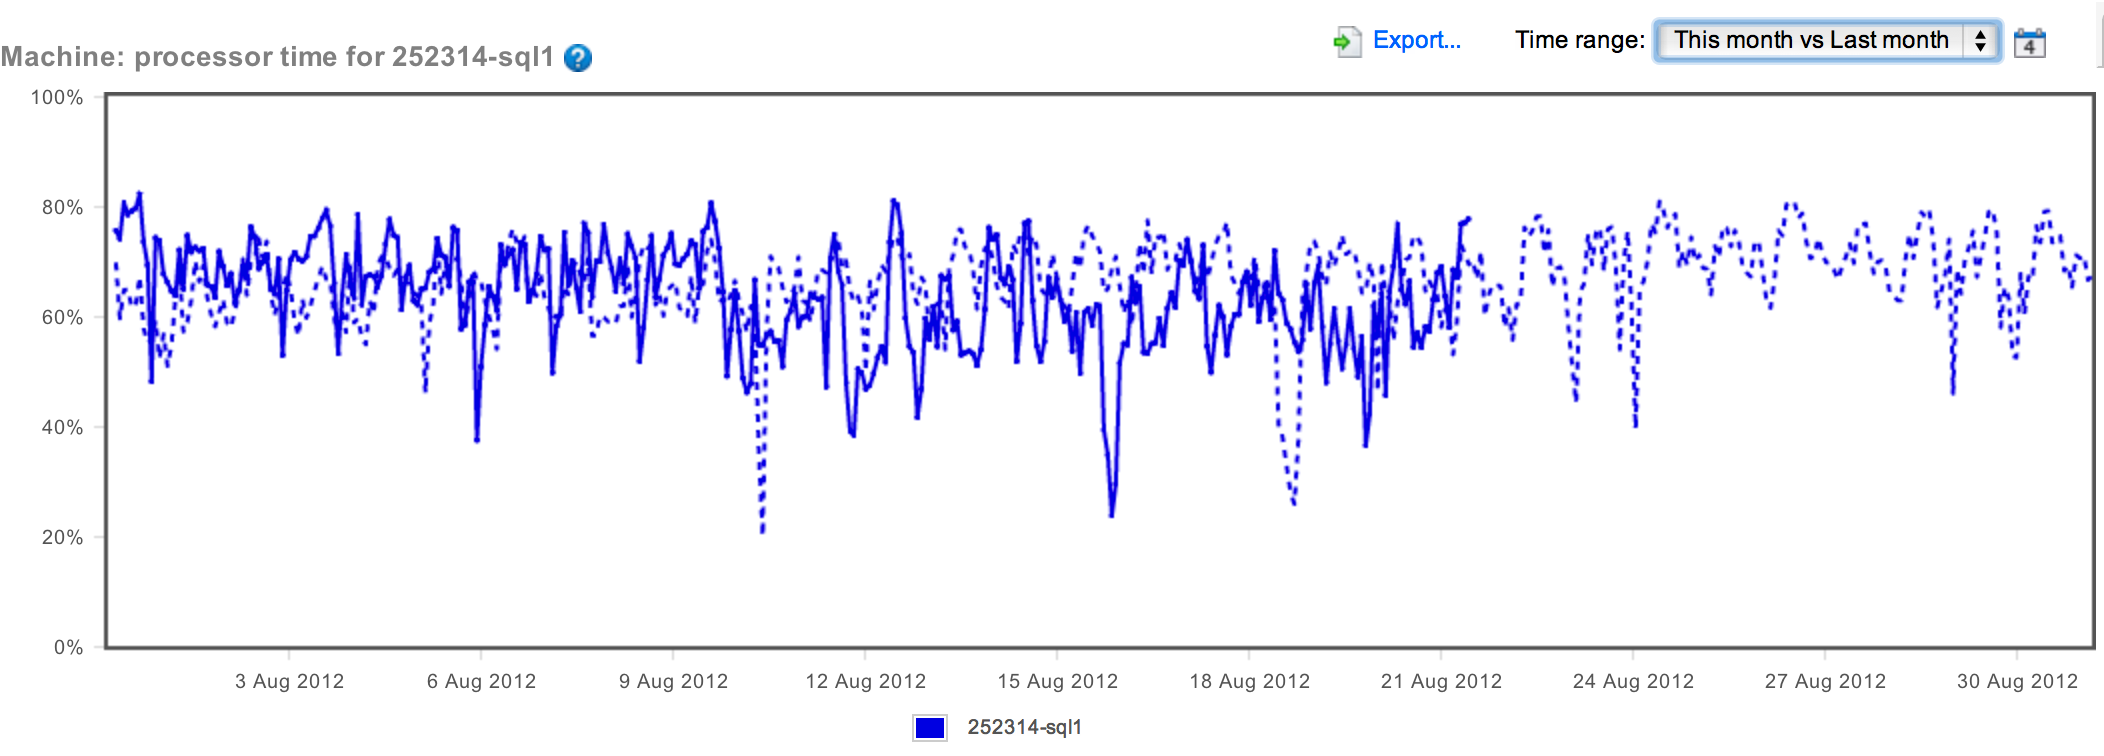
As you can see, while the sustained CPU is somewhat high, it's not getting worse. In fact, overall, last month looks a little worse than this month.
But I need something to write about. So, while CPU doesn't seem to be getting worse, it's still pretty consistently high. Let's see how I could drill down on the cause of the high CPU and see if there's something I can do about it. There was a sustained peak at 100% at around 2AM last night (and the same thing the previous night). I'm going to use the "Back in Time Mode" to get a look at the counters collected around then to see what was causing the high CPU. You do this by clicking on this button on the Overview page:

And then setting the date and time you're interested in. Scrolling down on the physical machine, I can look at the services to determine if SQL Server itself is the cause of the CPU being maxed out. The results are instructive:
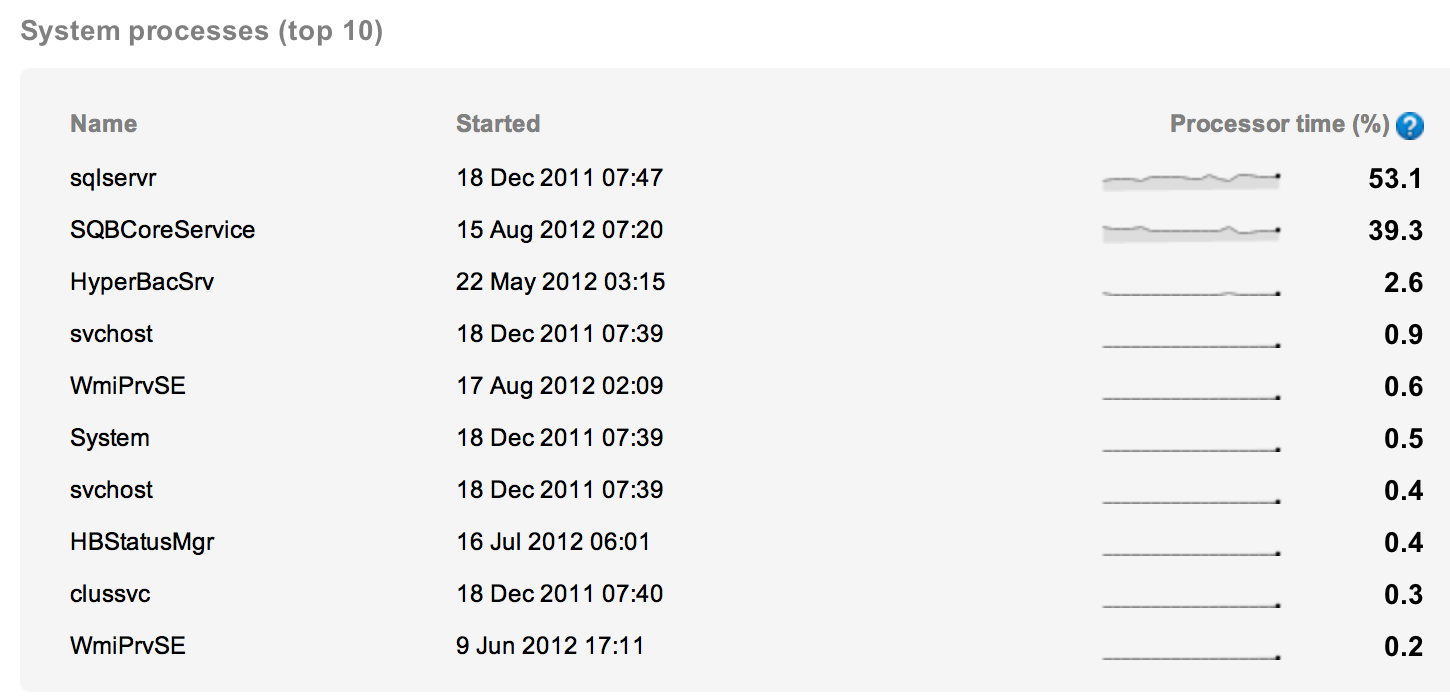
Yes, SQL Server is part of the full load, at 53% (and you know that's a sampled value, so it can be higher or lower than that, but you use the measures you've got). The other process is taking 39% of the load. In case you don't recognize that process, SQLBCoreService, let me tell you what it is. That's the SQL Backup process from Red Gate. We use all our own tools to manage our servers. So we're looking at the backup process in this instance. It's probably a full nightly backup and it's probably doing some serious compression.
Basically, all I've proven here is that you can't simply look at a single metric and derive anything meaningful from it. Let's try being more systematic.
What if I pick a different peak, say one that occurred on 8/20 at 20:21. I'll use the Back in Time method to look at the metrics and check the processes again. This time it's all SQL Server, so we know that something within SQL Server is causing spikes on the processor. Drilling down on the data from there, the first thing I check is the processor queue. The measured average is only .4 at peaks around that time, so we're not looking at multiple processes fighting over the processor. That means one event is causing the problem.
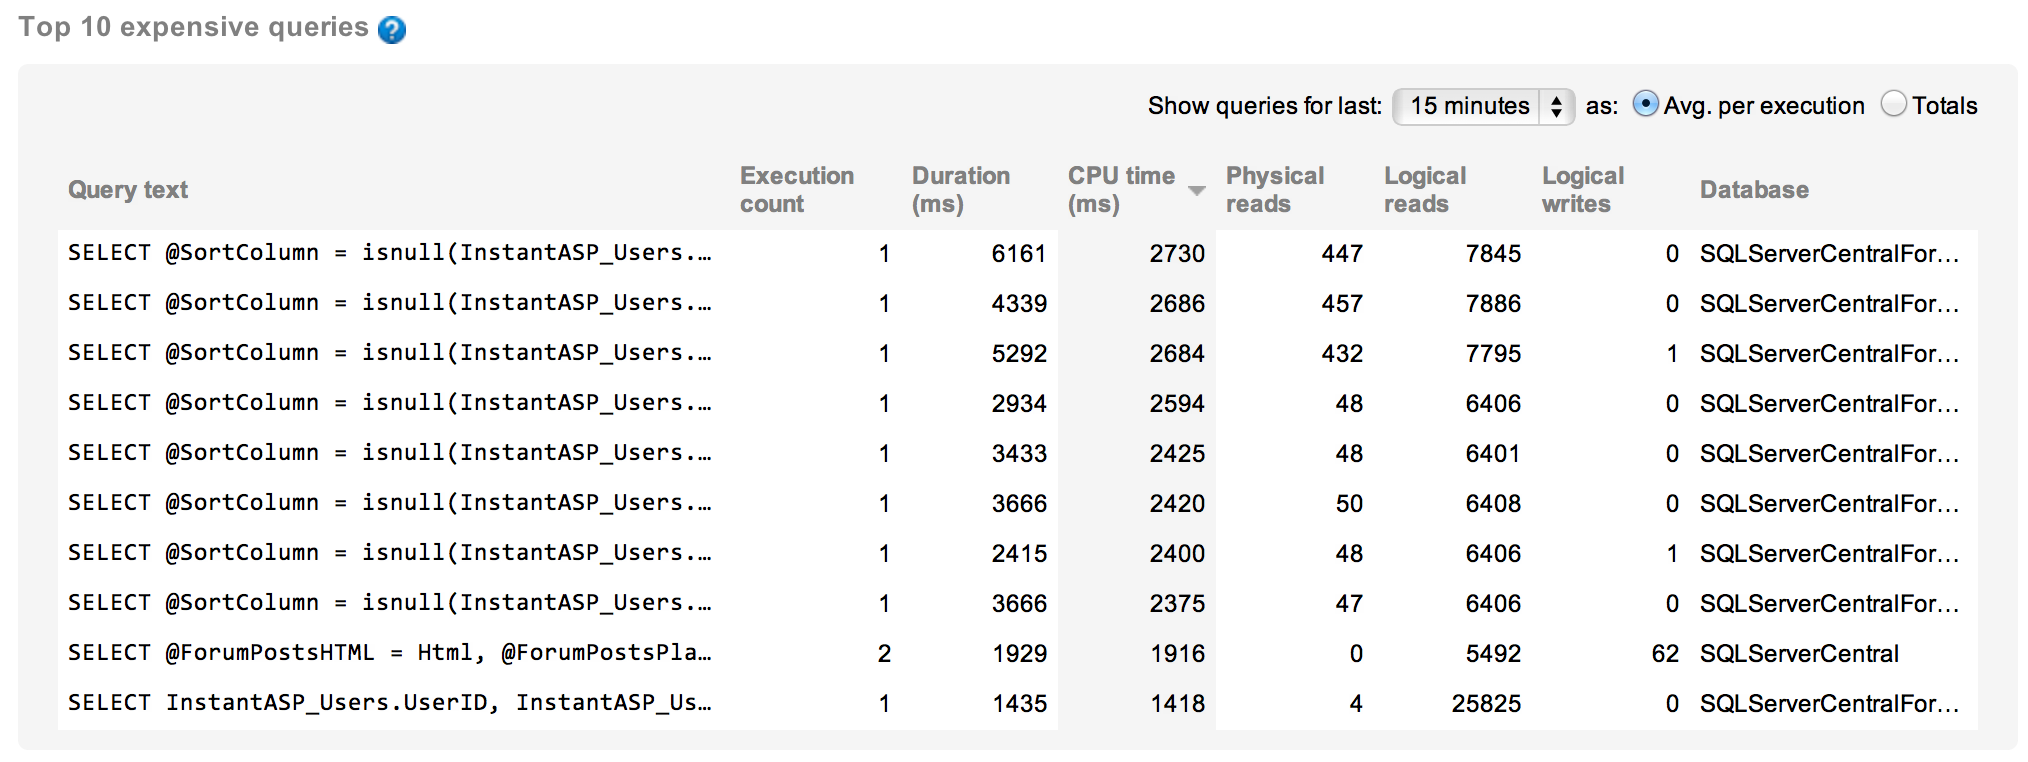
That leads me to take a look at the queries executing at that time. I can look at the queries from an individual basis and from an aggregate basis. This will allow me to spot individual calls from a query that is misbehaving or see when a query, in aggregate, is causing problems. First, the individual calls, ordered by CPU time:
And here are the queries in aggregate:
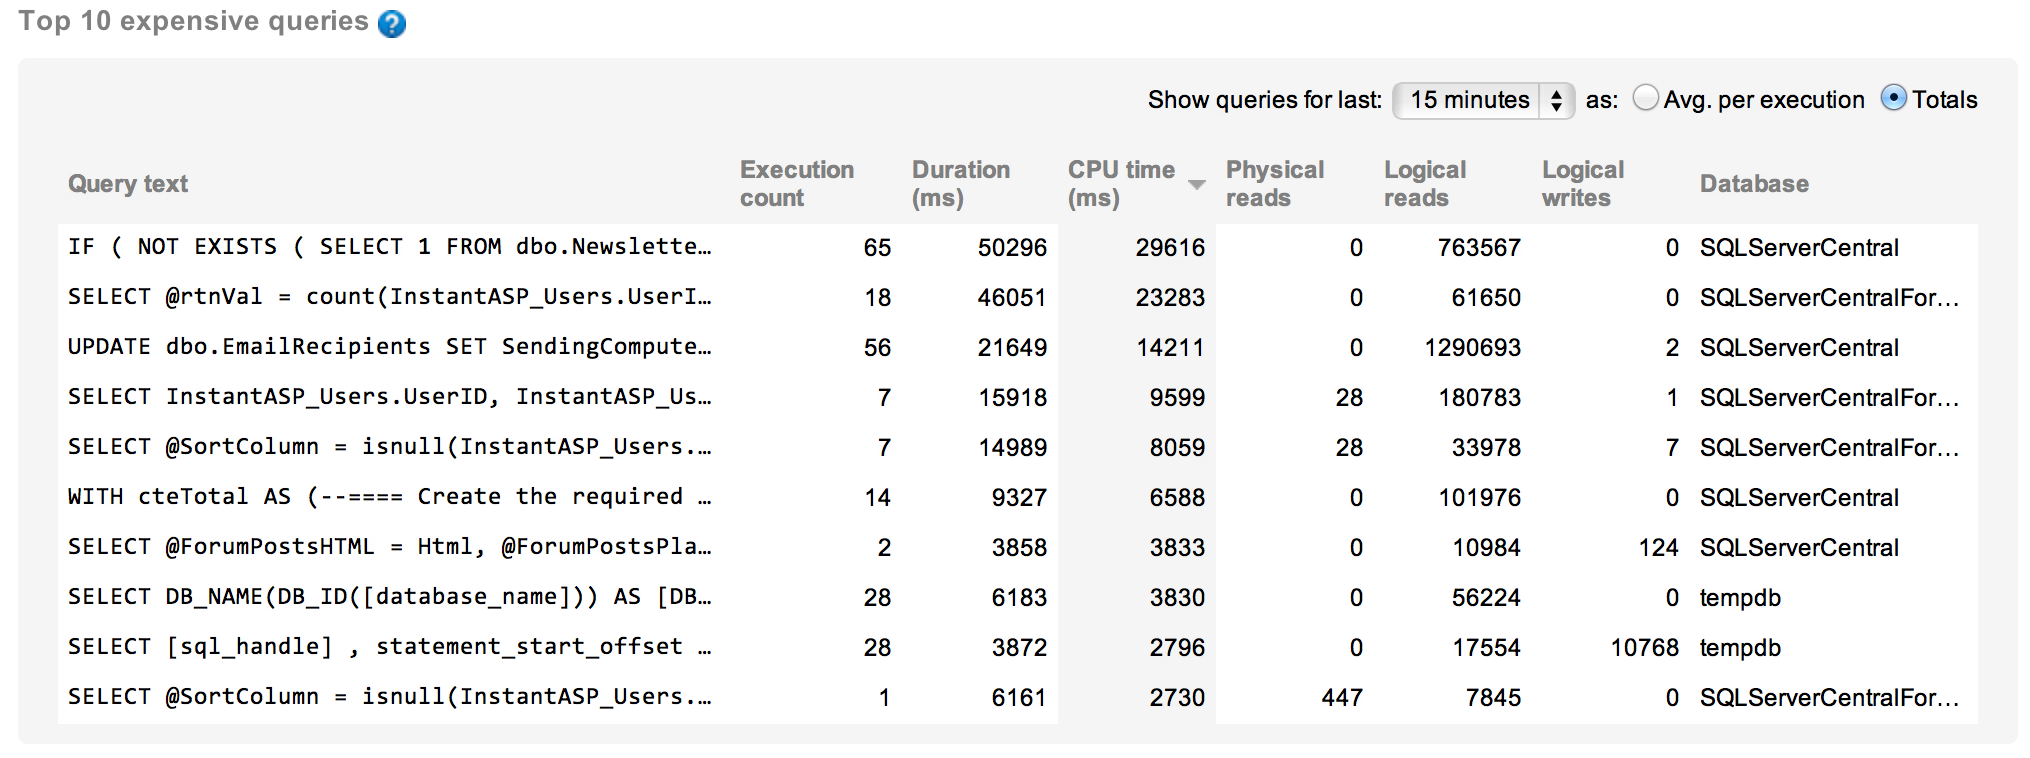
With those two views on the queries running during that peak period of CPU use, we can tell that one was clearly the cause of most of the usage. With individual run times over six seconds, this query needs to be investigated further to see if there are tuning opportunities:

What I might be able to do to tune this query I'll save for another post.


