
SQL Server Analysis Services (SSAS) manages what is called an Analytical Database. The first term for this kind of database used was Online Analytical Processing or OLAP. A clue why one might need this is when end users want a certain report changed and the change is just the grouping column. This second report request may change in 1 or 2 months to another grouping. Instead of category and subcategory, someone wants region and country. The IT department ends up with multiple copies of the same report or the same custom code in the multiple reports. A favorite is when someone requests the data for a report in a csv or text file. It usually means the data is going to be imported and reported in Excel or a similar tool.
An analytical database contains the business rules for aggregations in one container. Many business types use analytical databases for decision support and business intelligence. The idea is to have one centralized location for querying analytical data and create measured aggregations. This is part of a data warehouse and would be available for all reporting tools. The processing of aggregations is typically once a day after nightly ETL processing. More recently, analysts want real time data. This has led database engines to upgrading their abilities to handle the traffic and concurrence increases.
Using Analysis Services
Where would an Analysis Service database be used? Figure 1 is a PivotTable in Excel connected to Analysis Services.
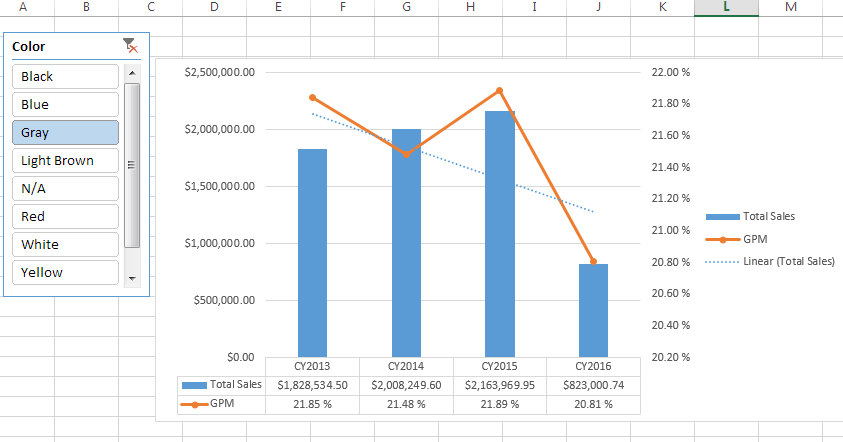
Figure 1 Pivot Chart from Excel connected to SSAS
The slicer in the top left is for the Color of the products. The chart provides two measures – Total Sales and GPM (Gross Profit Margin). Sales are the bars while the GPM is the line. The shared x-axis is Calendar Years. There is even a dotted trend line based on total sales of the years selected. The trend line is the analytics, while the bar and line charts show the performance. The year 2015 seems to be the highest totals sales while the 2016 is the lowest performing. Being able to filter the data by Color is what the slicer provides. The analyst is easily able to move from Black to Gray or a combination with the click of a mouse. There is no need for an additional report created for selecting different parameters for a new grouping. The connection to Excel for the analytical database gives the user a tool and data to change the displayed results.
Figure 2 shows a Power BI report connected to the same Analysis Services database. The visualizations of Total Sales, Bar and Line chart combo as well as a Matrix with Year slicer can really improve the presentation to upper management. Power BI does not replace Excel. The day to day analyst will need a tool like Excel. Power BI helps highlight the data that needs further investigation. The key here is that a common database, Analysis Services, is being used as the backend source for both reporting tools. That is what makes it an enterprise solution and a solid development path.

Figure 2 Power BI Report
What is Analysis Services?
Analysis Services (SSAS) is termed an Online Analytical Processing database or OLAP database. Compared to an Online Transaction Processing database (OLTP), the data has more of a de-normalized structure than the transaction database. The reporting against the OLAP database does not affect the transactions on the OLTP system(s). That is one of the best benefits. Data Marts consisting of dimension and fact tables work best for Analysis Services.
SSAS is part of a larger data warehouse for enterprises. The data might be scattered in multiple systems and the data warehouse brings them together in one reporting system. SSAS helps bring this data together with faster retrieval and the creation of aggregations or measures. Measures might be as simple as Sum of Sales or an intermediate measure like Gross Profit Margin. Figure 3 shows a Key Performance Indicator (KPI) for Gross Profit Margin with indicators for upper and lower targets. More advanced abilities of SSAS include Time Intelligence like Year over Year comparisons.
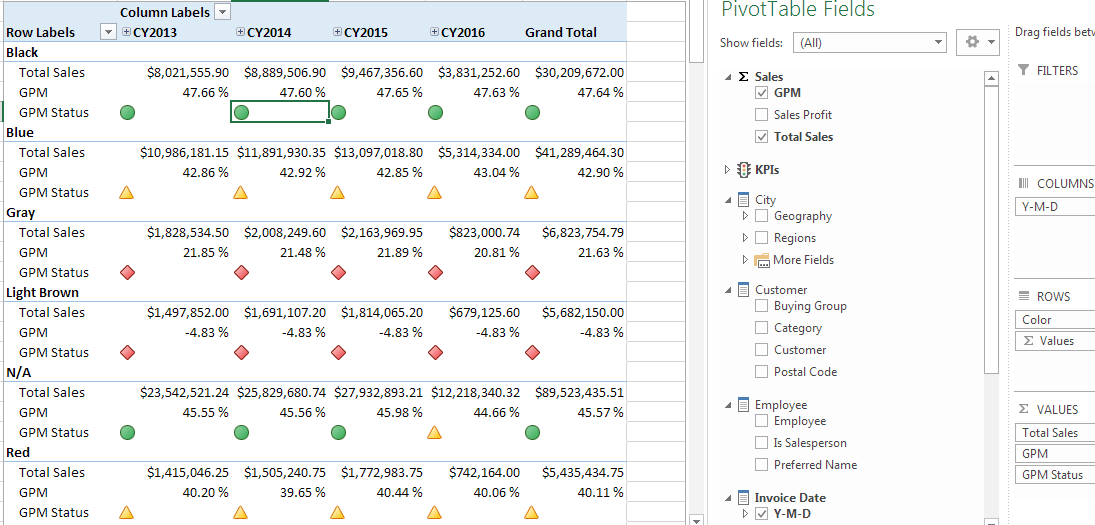
Figure 3 Key Performance Indicators by Gross Profit Margin
SSAS has been around since SQL Server version 7.0 with the first release of an Online Analytical Processing (OLAP) database. This was through the acquisition of Panorama Software. The original structure was a Multidimensional Cube and it still exists today (2017 release of SQL Server). The SQL Server 2000 edition included Data Mining which is still in the Multidimensional configuration an SSAS project. The first Tabular Model was in the 2012 release. Tabular was originally built as a multiuser solution for PowerPivot embedded in Excel. This model was obtained when Microsoft bought the VertiPak engine and developed xVelocity.
The mature Multidimensional version is still used in enterprises, but with the release of 2016 and 2017, the path forward looks to be the Tabular Model of SSAS. The transformation from Cubes to Tabular means going from disk based to memory based in addition to using column storage instead of row storage. Kind of sounds like where the database engine is progressing – columns store indexes and in-memory tables. This is all to help speed things up and move towards real time analytics. Both models can slice and dice measures through the attributes or hierarchies of dimensions.
Dimensional Modeling
Figure 4 shows a data mart structure. This represents a star schema with a fact table related to dimension tables.
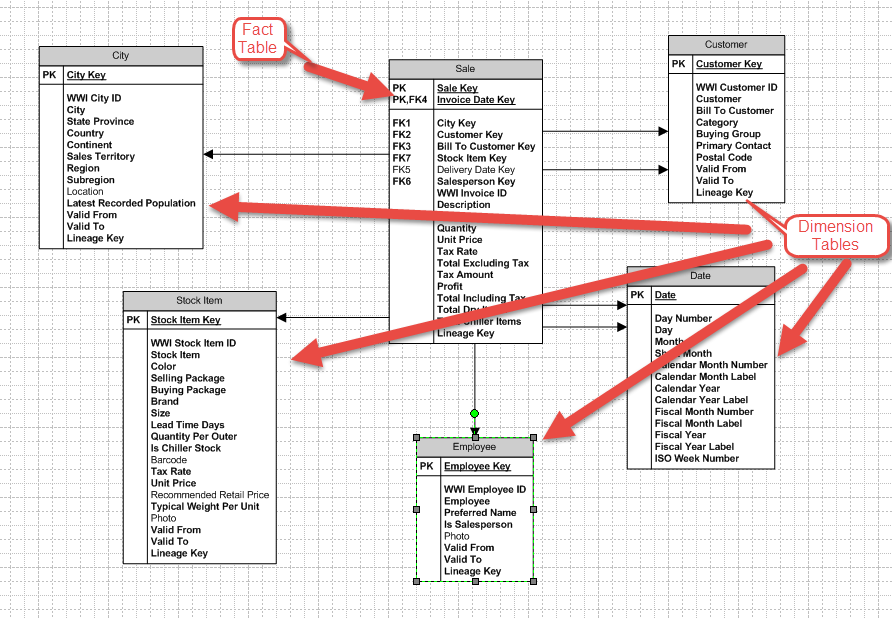
Figure 4 Start Schema Sales data mart
The center of the star schema is the Sales fact table. The grain of this table is Sales Line Item. The key is the combination of Sales Key and Invoice Date Key which are surrogate keys, not business keys. The business key would be Invoice Number plus either Line Item number or Product Code. Data Marts do not use business keys to uniquely identify rows, but these are used for lookups when importing data. Surrogate keys are generated during the import or ETL process for these databases.
This follows dimensional modeling practices which have been around for more than 20 years. The dimension tables are the entry to sales data like region of sale, color of item, or year of sales. The dimension as well as fact tables are flattened relational tables from one or more transactional systems. The Date dimension has rows for all possible dates, not just dates that have data. The date dimension can be related to more than one field in the fact table. Figure 5 zooms in one the date relationship.

Figure 5 Invoice Date Key and Delivery Date Key
The date keys in the Sales table are Invoice Date Key and Delivery Date Key. Both are integer data types, not date or datetime data types. The structure also includes just the date portion (2018-01-01) of the original column and not the time (11:38:08). The data warehouse usually does not have a requirement for Date + Time groupings, but rather Year, Quarter or Month analysis. The time portion can be added but it would be in a different key column in the fact like Invoice Time Key. This time key column would also be related to a Time dimension and not the Date Dimension in Figure 5.
The other dimensions are City, Employee, and Customer. Employee and Customer are typical lookups for invoices, but City seems out of place. The City is the geography of the Sale. This is separated because the dimension table can and is related to other Fact tables like Orders and Inventory. This way, slicing by Region in the City dimension can be compared to measures in other fact tables. This is an example of the ‘de-normalizing’ of data in a data warehouse.
This dimension also has columns like State Province, Country, and Continent (Figure 6). These form a hierarchy for slicing and dicing data in a report. It also helps the OLAP database to pre-aggregate results for the lower levels of the hierarchy for quick measure computation at a higher level. This is another benefit of an OLAP database – pre-aggregations of hierarchy columns in a dimension.

Figure 6 City dimension
This structure makes the data sourcing for Analysis Services much less complicated. Maybe a new computed column must be added like Full Name instead of First and Last Name, but most of the data logic has been replaced in the ETL steps. More time is spent with the requirements for measuring the business – Business Intelligence. Measures are the aggregation the business wants to report on like Total Cost, Line Item Profits, and Gross Profit Margin.
A dimension can be conformed to more than one fact table. Figure 7 shows the conformed dimensions Date, Customer, and Stock Item. These three tables are related to fact tables Order and Sale. The attributes like Category from Customer or Color from Stock Item can be used to view measures from both fact tables. This enables visualizations or tables to show aggregations from more than one fact table sliced by the dimension attributes. Conformed dimensions are a powerful aspect of dimensional modeling.

Figure 7 Conformed Dimensions
How it works
SSAS is a service that runs on a Windows Server or Azure just like the database engine. Other Business Intelligence services that come with SQL Server are Integration Services (SSIS) and Reporting Services (SSRS). Some might also include Data Quality Services (DQS) and Master Data Services (MDS) as SQL Server Business Intelligence tools. Microsoft has been able to cover all the bases with this suite of tools for the enterprise. Porting all of these to the cloud will be a big push in the next couple of years.
The data is served to end users that have certain permissions. SSAS use Windows Authentication so to access the data, a user must be verified through an Active Directory or Windows account. There is no SQL login like the database engine can use. Security teams will be excited that permissions can be managed from Active Directory. The services can be run by an Active Directory service account to lock down admin access to the data contained in a database.
SQL Server Data Tools (SSDT) is used for the development of an SSAS database. SSDT is also used for Reporting Services (SSRS) and Integration Services (SSIS). DQS and MDS has its own development environment. Projects are organized in a solution like .Net solutions and the solution can have multiple projects of different types. So, SSRS and SSIS projects can be in the same solution as SSAS. Since SSDT is a shell of Visual Studio, Team Foundation Server can be used as a Source Control for these Business Intelligence tools. Figure 8 shows the components of an SSAS project in SSDT.
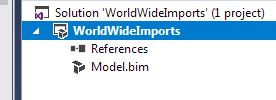
Figure 8 SSDT Solution and Project
The model file of a tabular model contains all the code for an SSAS project which is deployed as a database to an instance. Figure 9 shows some of the components of a project and model. The Tabular Model Explorer in the top right shows different object types like Data Sources, KPIs, Measures, etc. The main work area is the open model file which is called the Grid view. This is structured like a spreadsheet with a section below the rows of data for calculated measures. The figure shows one for Total Sales as well as GPM as well as the tables in tabs.
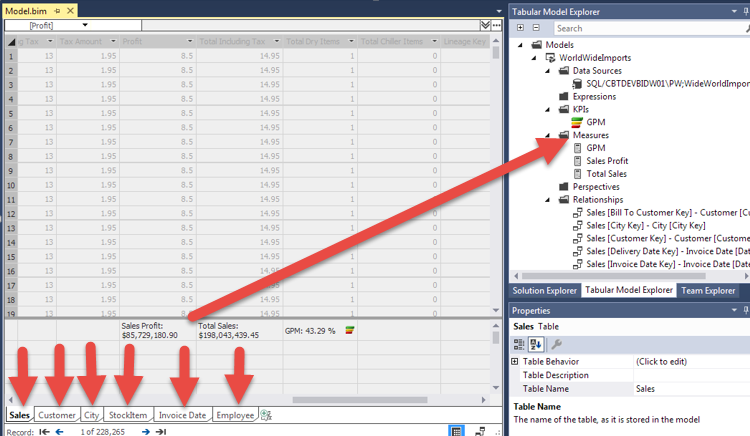
Figure 9 Opened Model file in a Project
This project is deployed to a server to be accessed by others with permissions. The deployment gives the application the enterprise level that makes the database valuable to the business. Once someone starts to use an OLAP database, requests for expansion blossoms. This expansion is much easier when the data marts are structured in the dimensional modeling design mentioned earlier.
Conclusion
This first article in the series helps with a high-level look at SSAS while digging a little into some details. The access to the data in Excel and Power BI shows the upper management view as well as a more detailed analysis. Reviewing the Business Intelligence features of SQL Server proves Microsoft is committed to the enterprise data warehouse (EDW) on premise as well as the cloud. To create a great tabular model, implementing dimensional modeling will progress the maturity of an EDW. SQL Server Data Tools helps centralize the projects for certain BI tools from Microsoft which makes development available to all workers involved.
