In both a recent article and a recent editorial I touched on the need to test and evaluate hard numbers when doing performance tuning. However the method of doing so may not be immediately obvious. So for this article, I’m going to take a moderately complex query and walk through a few attempts at tuning the query, showing tests at each step and evaluating each step for effectiveness.
Let’s start with the query. I’m using a padded version of the WebForums database and SQL Server 2014. The smaller version of the database can be downloaded from an old Simple Talk article, Finding the Causes of Poor Performance in SQL Server, Part 1. Here is the code I want to tune.
  DECLARE
    @StartDate DATETIME
  , @EndDate DATETIME;
  SET @StartDate = '2014/01/01';
  SET @EndDate = '2015/01/01';
  SELECT
      f.ForumName
    , DATEADD(MONTH, DATEDIFF(MONTH, 0, p.PostDate), 0) AS Month
    , t.Title
    , u.UserName
    , COUNT(*) AS ThreadPostCount
    FROM
      dbo.Forums AS f
    INNER JOIN dbo.Threads AS t
    ON
      f.ForumID = t.ForumID
    INNER JOIN dbo.Posts AS p
    ON
      t.ThreadID = p.ThreadID
    INNER JOIN dbo.Users AS u
    ON
      p.Poster = u.UserID
    WHERE
      t.CreatedOn BETWEEN @StartDate AND @EndDate
      AND f.IsPublic = 1
    GROUP BY
      f.ForumName
    , DATEADD(MONTH, DATEDIFF(MONTH, 0, p.PostDate), 0)
    , t.Title
    , u.UserName;
This isn’t all that complicated a query, and with 25 million rows in the largest table, it takes around 140 seconds to run on my laptop. Not half bad for a mess of a query on a database that’s severely lacking in indexes (because I designed the database that way).
To get more precise performance characteristics, I’m going to use two things. Statistics IO (because it’s a nice breakdown of reads per table) and Extended Events (for the CPU, duration and overall reads).
It should go without saying that I’m not doing this tuning exercise on a production server. But in case it does need to be said, this kind of work is NOT done on the production server. Firstly doing so will impact the production server. Second the other load will impact the results of the tests. We want a dedicated machine for this, with no other users. It’s important when doing tests like this to ensure that the only variables changing are the ones that we are testing. We want all tests performed on the same server, from the same client, with the same processes running on the server.
Turning Statistics IO on is easy. In the same query window, run this before any other batches.
SET STATISTICS IO ON
GO
One thing that needs to be mentioned quickly. Had there been any user-defined functions within the query, Statistics IO would give incorrect results. There aren’t any in this code, so Statistics IO should be safe to use. Had there been UDFs, I’d have to rely just on Extended Events.
So, let’s gather some stats to start. Physical reads are omitted because they are zero for all tables. That’s because I always discard the stats from the first execution as the results will be skewed due to plan compilation and fetching data from disk. These values are from the second execution of the query that we are tuning.
Table 'Users'. Scan count 9, logical reads 307.
Table 'Forums'. Scan count 1, logical reads 2.
Table 'Workfile'. Scan count 0, logical reads 0.
Table 'Worktable'. Scan count 0, logical reads 0.
Table 'Threads'. Scan count 9, logical reads 41212.
Table 'Posts'. Scan count 9, logical reads 450549.
Table 'Worktable'. Scan count 0, logical reads 0.
From the output of Stats IO it looks like the two tables, Threads and Posts, are the ones we need to look at.
Now, here is the Extended Events setup I use to test:
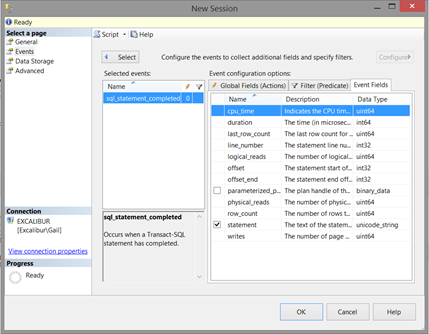
As you can see, capturing just the one event is enough for the testing we’re doing. Select the Ring Buffer as the storage target. Start the session and then use the Live Data option to see what it’s picking up.
The performance-related results for out test query are:
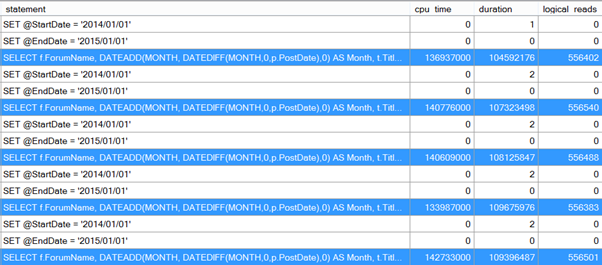
I’ve highlighted the query we are tuning. You can ignore the variable assignment lines. Don’t panic. Tthose duration and CPU values are in microseconds.
I ran the query 5 times because I want to average the CPU, duration and reads. As can be seen from the above image, there are variations in all three across the executions. Hence I want an average so that I don’t draw conclusions about relative performance of queries from what’s actually just a slightly higher or lower value within the range of values that one query has. If one query has vastly different CPU, duration or reads than the others, then it suggests that some other variable has changed behind the scenes and that the test should be rerun. Don’t discard the outlier, rerun the entire test as you don’t know which result is skewed.
If we average those five results, and convert the CPU and duration to milliseconds, we get:
- CPU – 139 008
- Duration – 107 822
- Reads – 556 4628
There are three tuning options I want to try as part of optimising this query. I’m not going to play with the text of the query because it’s not too badly written. Rather I’m going to look at nonclustered indexes on the Forums and Posts tables, partitioning the Threads table, and converting the Threads table to a clustered ColumnStore (because, why not?). These aren’t the only optimisations that could be done to this query, but for the purposes of this article they’re enough to show the methodology. Further optimisations are left as an exercise to the reader.
First up, let’s look at the indexes on the Posts and Forums tables
The Forum table is pretty easy to choose an index for, as we have a filter on the isPublic column, a join on the ForumID column, and are returning the ForumName. Let’s start by trying
CREATE NONCLUSTERED INDEX idx_Forums_isPublic
ON Forums (isPublic, ForumID)
INCLUDE (ForumName)
With that index created, we rerun the query and examine the execution characteristics. We see no improvement worth mentioning. In fact we get higher CPU, duration, and reads. Not much higher, but there’s definitely no improvement here and hence the created index didn’t help.
- CPU – 142 640 (Previously 139 008)
- Duration – 110 458 (Previously 107 822)
- Reads – 556 558 (Prevously 556 462)
So we drop the new index on the Forums table and try something else. The Something Else is an index on the Posts table. There’s no WHERE clause predicate on that table, but there’s a join on ThreadID, a join to the Users table on the Poster column, and an aggregation based on a function called on the PostDate column. Let’s start here by trying
CREATE NONCLUSTERED INDEX idx_Posts_ThreadIDPostDate
ON Posts (ThreadID, PostDate)
INCLUDE (Poster)
If this was a real tuning exercise, I’d test several index columns and column orderings, based on what I thought the optimiser might like best. To keep this article from becoming a book, only one index on each table is shown, but that doesn’t mean it’s the only one possible. If we were testing different indexes, we’d take the performance stats for the query with each index, one by one, then see which index has the best effect, and confirm by looking at the execution plan that there are no further obvious improvements. That’s a little out of scope for this article though
And again we rerun the query after creating the index. If we look at the stats again, we do see an improvement.
- CPU – 101 674 (previously 139 008)
- Duration – 63 296 (previously 107 822)
- Reads – 187 505 (previously 556 462)
That’s a definite improvement, so that index stays.
Next thing I want to try is to partition the Threads table on the date column, with one partition per year. However if I do that straight away, I’m going to be making two changes at once. First changing the clustered index (which is currently on the ThreadID column) and second, partitioning the table. If there’s a performance improvement I won’t be able to tell which change was responsible. So the change has to be done in two parts, first change the clustered index, then test, then partition the table, then test again.
If the table is to be partitioned on the CreatedOn column, then the logical choice for the altered clustered index is the CreatedOn column. Yes, we could make a composite on ThreadID and CreatedOn, but that’s overly complex.
Changing the clustered index is a little trickier than a nonclustered index. Since the clustered index is the enforcing index on the primary key, any referencing foreign keys need to be dropped before we can do this and then recreated afterwards.
ALTER TABLE dbo.Threads DROP CONSTRAINT PK_Threads;
CREATE CLUSTERED INDEX idx_Threads_CreatedOn ON dbo.Threads (CreatedOn)
ALTER TABLE dbo.Threads ADD CONSTRAINT Pk_Threads PRIMARY KEY NONCLUSTERED (ThreadID)
Again, we run the query we’re testing multiple times and averaging the CPU, duration and reads. Yes, this can get tedious fast, especially on slow queries.
- CPU – 119 193 (previously 101 674)
- Duration – 62 840 (previously 63 296)
- Reads – 154 569 (previously 187 505)
The logical reads are down, but CPU is up and duration is barely changed. I don’t like these results, especially from something with as much potential to impact other queries as a change to the clustered index. We’ll leave these for now and try the partitioning, but I’m currently leaning towards reverting this change.
Partition the table, then run the tests again.
CREATE PARTITION FUNCTION DatePartitionPerYear (DATETIME)
AS RANGE RIGHT FOR VALUES ('2010-01-01', '2011-01-01', '2012-01-01', '2013-01-01', '2014-01-01', '2015-01-01')
CREATE PARTITION SCHEME PartitionByDateToPrimary AS PARTITION DatePartitionPerYear ALL TO ([Primary])
CREATE CLUSTERED INDEX idx_Threads_CreatedOn ON dbo.Threads (CreatedOn)
WITH (DROP_EXISTING = ON)
ON PartitionByDateToPrimary (CreatedOn)- CPU – 118 918 (previously 119 193)
- Duration – 62 949 (previously 62 840)
- Reads – 154 561 (previously 154 569)
Err, no, the change didn’t improve anything. Well to be honest, that result was pretty much expected as partitioning is not a performance tuning technique. The process of testing and evaluating results is what this article is about however, so test partitioning we did.
Given the performance results showing a lack of improvement from the change of the clustered index and the partitioning, both changes are going to be discarded. If you’re following the code changes at home, one way is to restore the backup of the database and re-apply the changes that you’ve tested and are keeping.
Last thing, let’s try converting the Threads table to a clustered columnstore. Now ordinarily I wouldn’t do this to a table on an OLTP-type system. The loss of unique constraints, as well as all other indexes and foreign keys is a little too much to accept usually.
But since we’re just testing…
ALTER TABLE dbo.Threads DROP CONSTRAINT Pk_Threads
DROP INDEX idx_Threads_CreatedOn ON dbo.Threads
CREATE CLUSTERED COLUMNSTORE INDEX idx_Threads_ColumnStore ON dbo.Threads
And with the columnstore index in place:
- CPU – 57 618 (previously 101 674)
- Duration – 45 623 (previously 63 296)
- Reads – 165 288 (previously 187 505)
Compared to the best so far, that’s a large improvement in CPU usage, moderate improvement in duration and slight reduction in reads. If this was a real tuning exercise I may or may not consider implementing the columnstore index. My decision on whether you implement this would depend on a lot more than just this one test.
In summary:
- Index on Forums table – not effective
- Index on Posts table – effective, change kept
- Change the clustered index on the Threads table – not effective
- Partition the Threads table by year – not effective
- Change the Threads table to a Clustered Columnstore – effective, change may be kept depending on other factors including the other queries that use the table and the DBA/developer’s comfort level with columnstore indexes
I hope this walkthrough of a query tuning exercise has given readers some ideas on the benefits of doing query tuning in a methodical, structured way and of basing decisions on hard data and results.